
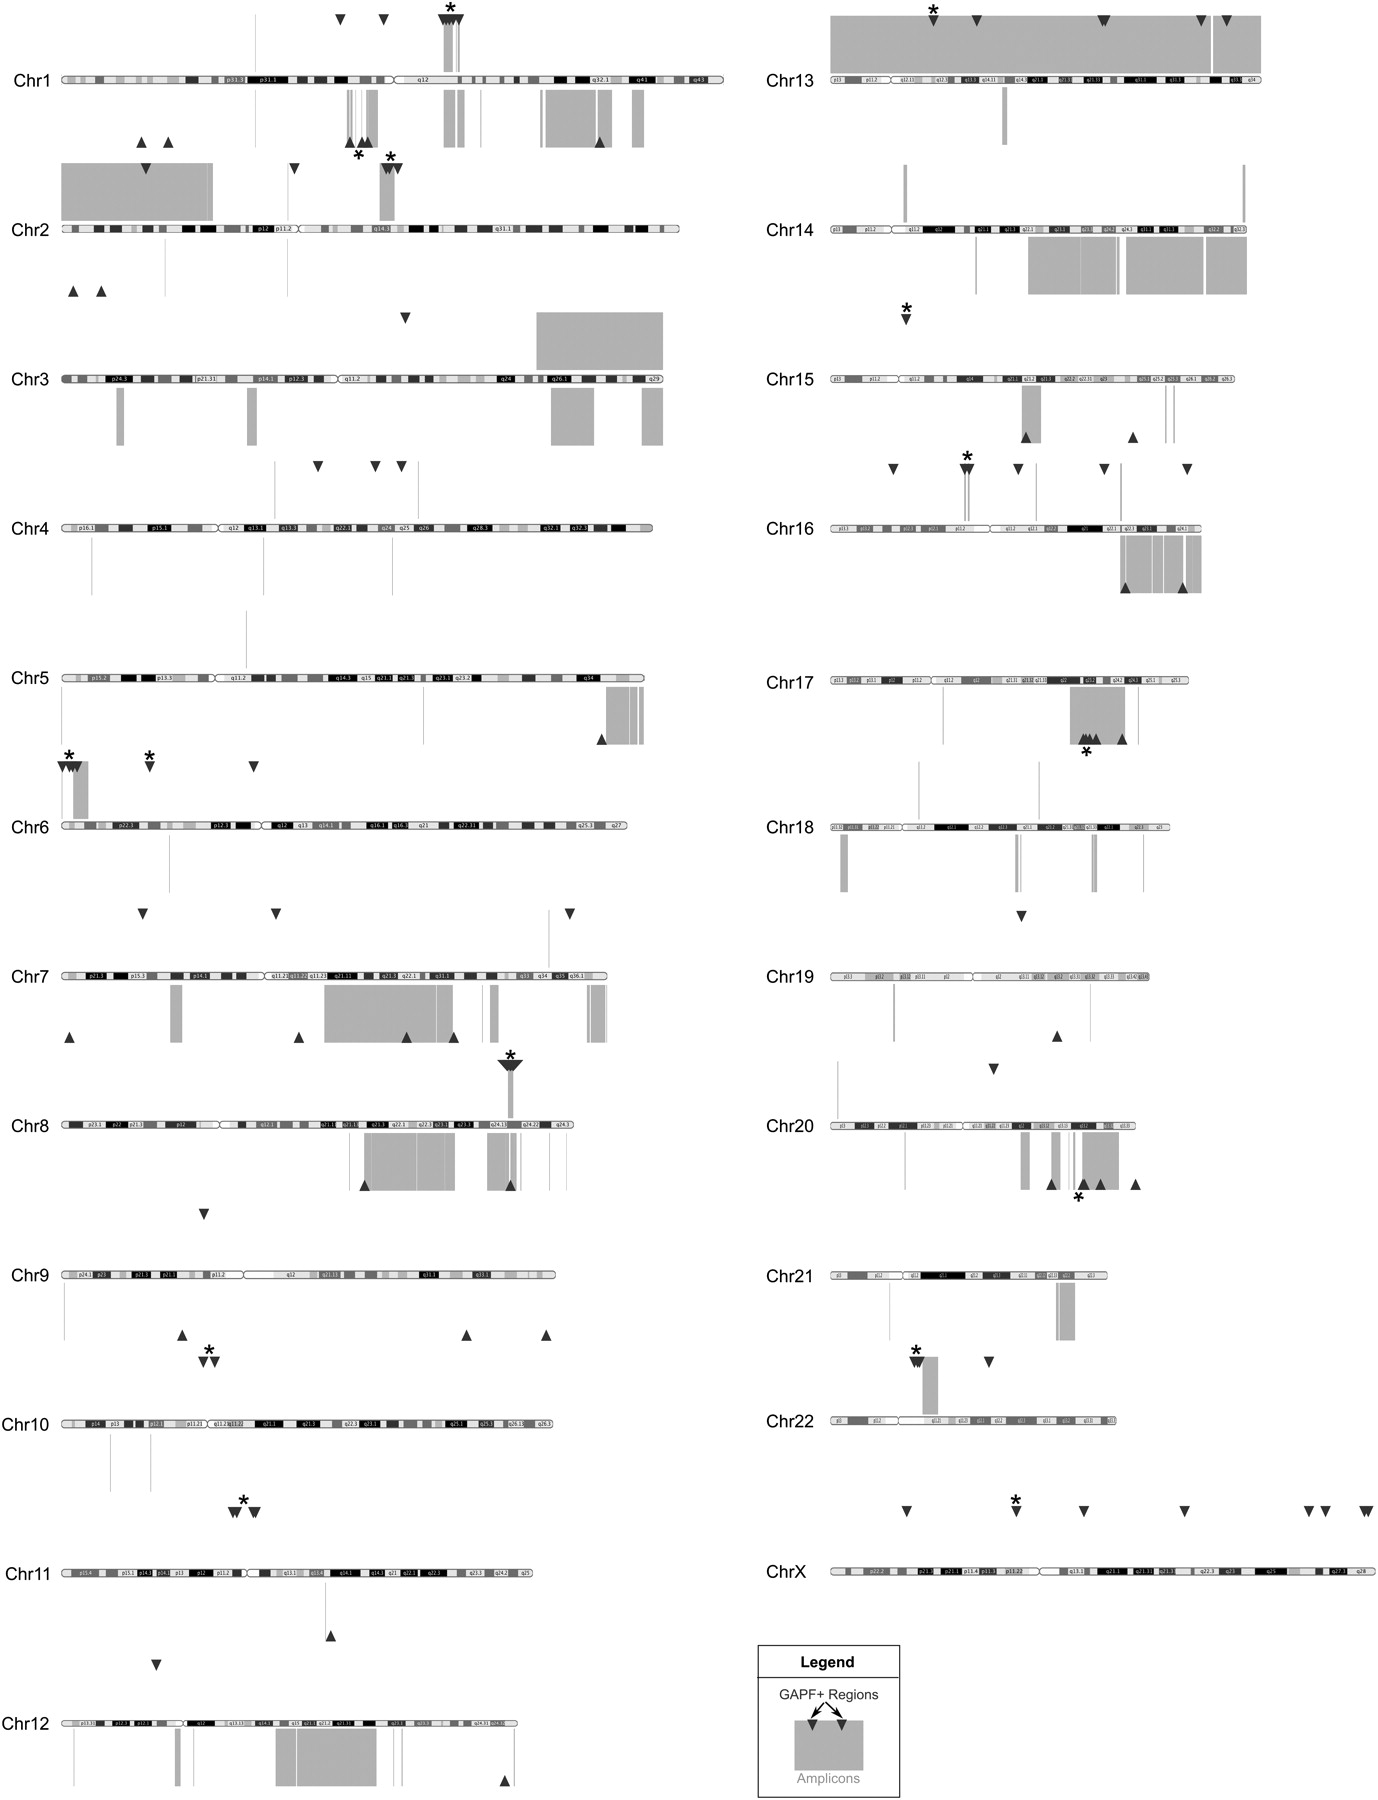
GAPF-positive regions cluster in copy-number gains in cell lines Colo320DM and MCF7. Genome graph depicting locations of GAPF-positive regions (P < 0.001, log2 signal ratio > 1.5; triangles) and copy-number gains (log2 signal ratio > 0.3; boxes) across the genomes of colon-cancer cell line Colo320DM and breast-cancer cell line MCF7 as compared with cultured HFs. GAPF-positive regions and copy-number gains detected in Colo320DM are shown above and regions identified in MCF7 are shown below each chromosome ideogram. Clusters of at least three GAPF-positive regions that had a <5% probability of randomly occurring within a 10-Mb window are marked by asterisks (*). Chromosomes are drawn approximately to scale.


