
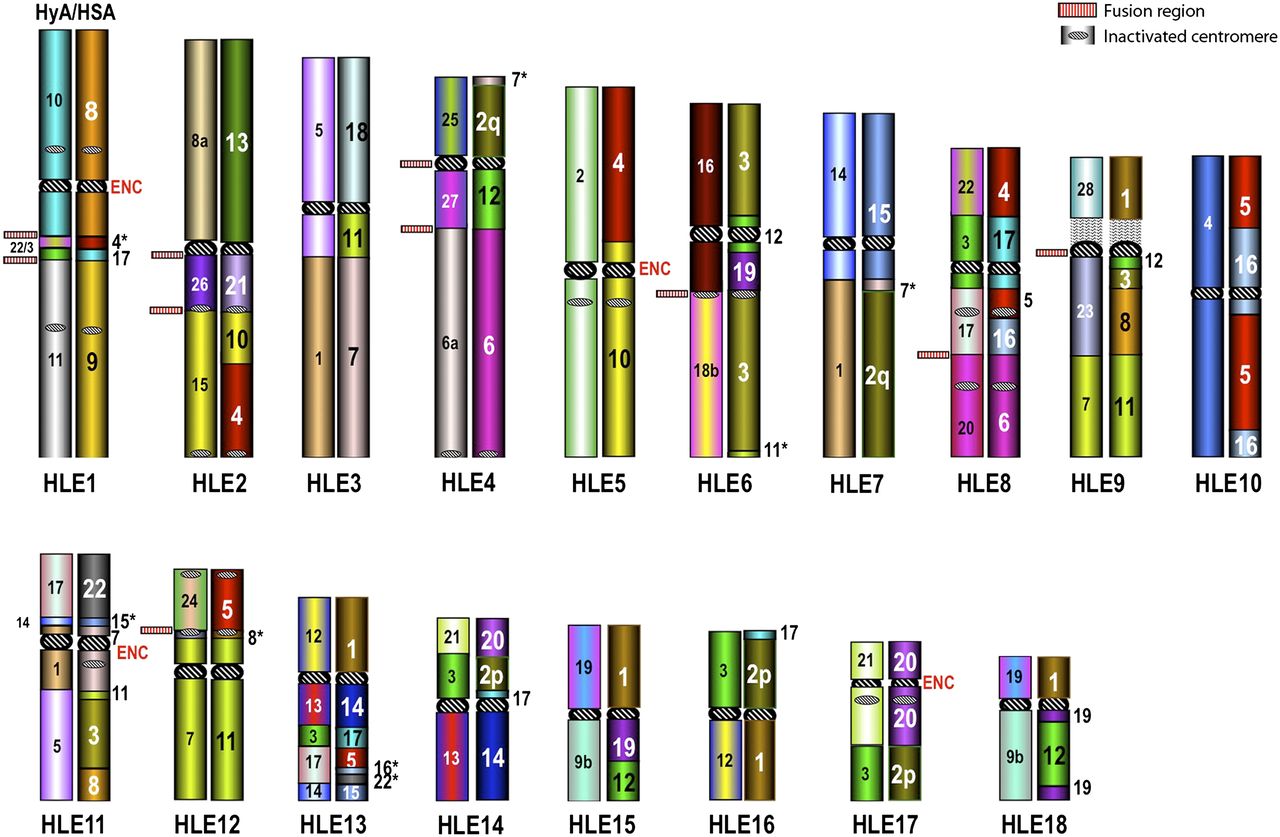
Figure 1.
Two distinct ideograms for each of the 18 HLE autosomes. The ideogram on the left reports the synteny block arrangement with respect to the Hylobatidae ancestral karyotype (HyA) reported in Figure 3, to which the colors also refer. The one on the right reports the homologous human blocks. For details, see Supplemental Table ST2 or the website http://www.biologia.uniba.it/hoolock. This figure also reports the fusion points, the evolutionary new centromeres (ENC), and inactivated centromeres.


