
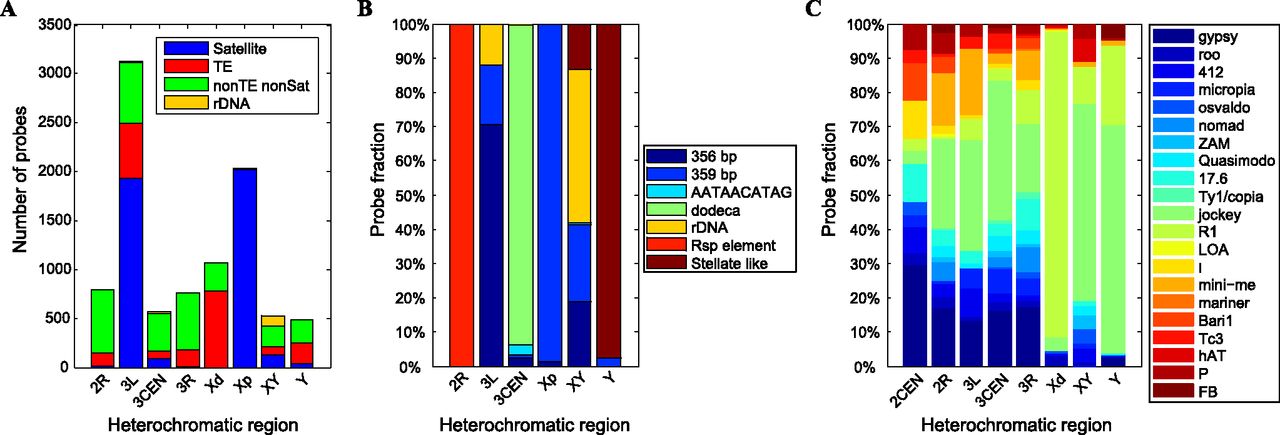
Figure 3.
Sequence composition of the H-probes. (A) Sequence composition of H-probes mapped to different heterochromatic regions. (B,C) Bar graphs summarizing the satellite DNA populations (B) and TE populations (C, grouped into clades) within H-probes mapped to different heterochromatic regions. (Xp) X1; (Xd) X2-4.


