
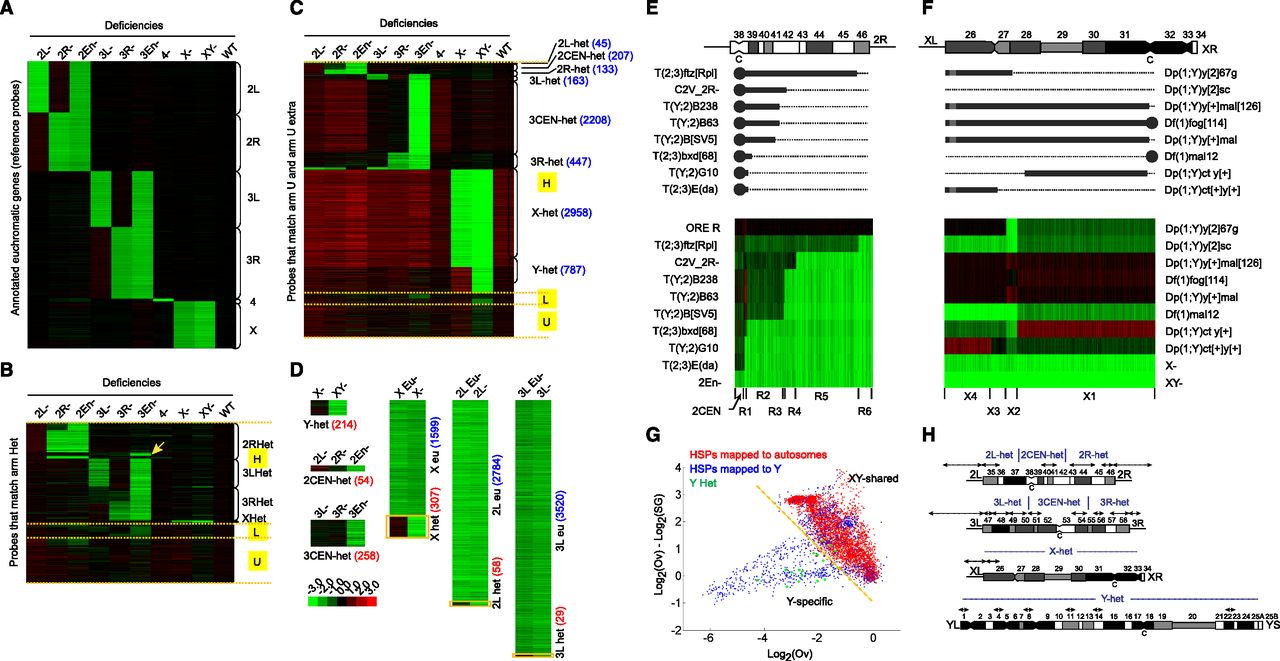
Assignment of unmapped H-probes to specific chromosomal regions by CGH analysis of chromosome deletions. CGH analysis of embryos lacking specific chromosomes or chromosome arms. (A) Single-copy euchromatic reference probes localized by their hybridization behavior to DNA deficient for individual chromosomes or chromosome fragments. Probes are clustered according to their chromosomal localizations as indicated on the right of the image. (Green) Fold decrease relative to Oregon R normal diploid reference. (Red) Fold increase. (B) Locations of H-probes that align to arm Het. Probes are clustered according to the position of their best match on arm Het. Each probe was mapped with either high confidence (H), low confidence (L), or unmappable (U). Note that we detected a previously reported misassignment of scaffold CP000217 from 3L to 2R (arrow) (Hoskins et al. 2007). (C) New assignment of H-probes that map to arm U or Uextra. Chromosome regions and number of probes mapped to each region are shown on the right. (D) Identification of novel H-probes from probes that do not have a perfect match in the reference genome but were mapped to a specific chromosome or chromosome arm. Novel H-probes mapping to 2CEN, 3CEN were identified based on their absence in deficiency DNA from compound entire stocks. For three chromosome arms (X, 2L, and 3L), novel H-probes are identified by CGH analysis of translocations breaking at the euchromatin/heterochromatin boundary. Numbers of H-probes mapped to the heterochromatin (het) or euchromatin (eu) are indicated. (E) CGH analysis of translocations with breakpoints in 2R heterochromatin. (Top) Cytological map of 2R heterochromatin and a model showing the translocation breakpoints. The cytological positions of the breakpoints were determined based on H-probes that match to 2R Het. (Bottom) Hierarchical clustering of H-probes that were mapped to 2R and 2CEN. These H-probes were further positioned into six nonoverlapping regions on 2R heterochromatin (R1–R6). (F) CGH analysis of the X chromosome rearrangements, including (1) Y duplicated for a piece of proximal X and (2) X deficiencies encompassing part or all of the X heterochromatin. Using hierarchical clustering, we were able to classify the X-specific H-probes into four nonoverlapping categories (X1–X4). Note that X4 contains almost all H-probes that match to X Het (h26). (G) Distinguishing Y-specific H-probes from those shared by X and Y by CGH analysis of polytene chromosomes from ovaries (Ov) and salivary glands (SG). Both groups were initially mapped to Y because they are depleted in X-Y−, but present in X-Y+. Y-specific H-probes are expected to be absent in female tissues and therefore show greater degree of depletion in ovaries than in salivary glands, whereas XY-shared H-probes are expected to be less depleted in the ovaries than in salivary glands because of the higher degree of polytenization in the latter (Fig. 4B). H-probes mapped to Y are clustered into two populations. One population that overlaps with autosomal H-probes and shows greater log2(Ovary/embryo) and log2(Ovary/Salivary gland) values is categorized as XY-shared, while the other population that overlaps with most control probes from YHet is categorized as Y-specific. (H) The position of chromosome regions on the cytogenetic map of Drosophila heterochromatin with numbered divisions (h1–h58) and centromeres (c). Modified from Gatti et al. (1994). The breakpoints of the compounds 2 and 3 chromosomes were determined according to the cytological location of the arm “h” and arm Het scaffolds (double arrows) and the sets of H-probes that match to them.


