
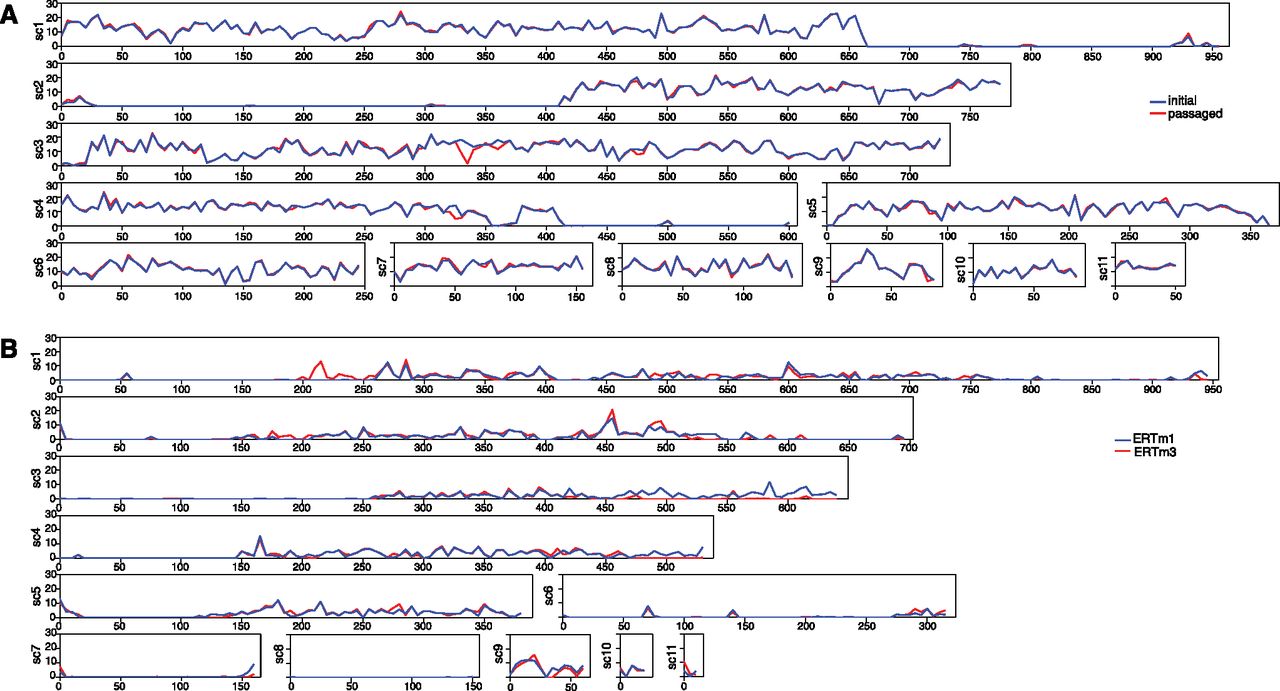
Distribution of SNPs in Nematocida highlights loss of heterozygosity. (A) The frequency of SNPs for sliding windows of 5 kb is plotted across the 11 largest scaffolds of Nematocida sp1 (ERTm2). Values on the x-axis correspond to scaffold position in kilobases; values on the y-axis correspond to the SNP frequency (SNPs/kb). The pattern of the initial isolate (red) is nearly identical to the passaged isolate (blue). Large regions exhibiting loss of heterozygosity are present in terminal regions of scaffolds 1, 2, and 4. (B) The frequency of SNPs for sliding windows of 5 kb is plotted across the 11 largest scaffolds of N. parisii (ERTm1). Values on the x-axis correspond to scaffold position in kilobases; values on the y-axis correspond to the SNP frequency (SNPs/kb). The patterns of SNPs for ERTm1 (blue) and ERTm3 (red) are highly similar.


