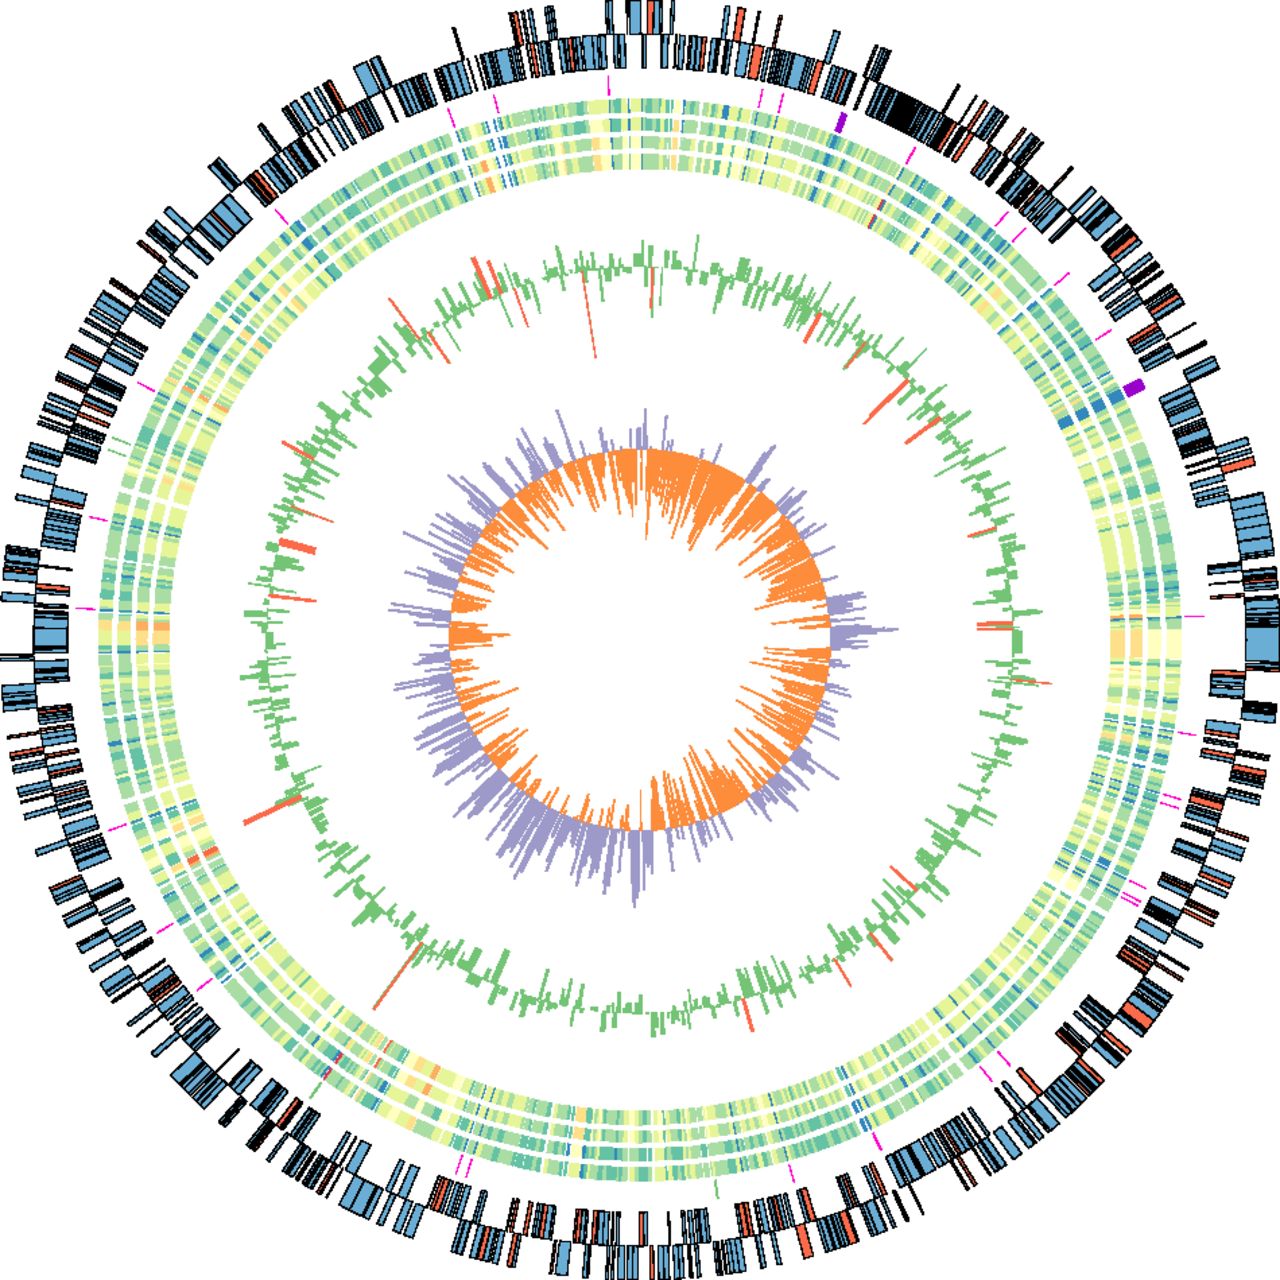
The chromosomal structure of wOo. Circles are numbered sequentially from the perimeter to the center. Circles 1 and 2 represent protein-coding genes on the positive and negative strands, respectively, with intact CDS colored blue and pseudogenes in red; the third circle shows structural RNA genes (rRNA, purple; sRNA, green; and tRNA, pink); circles 4–7 are heat-maps of transcript counts in male soma (4, 5) and female gonad (6, 7), with high expression colored red and low expression in blue; circle 8 is a plot of differential expression (DE) between male soma (outer profile) and female gonad (inner profile), where red coloration indicates statistically significant DE at P < 0.05; and circle 9 represents the percentage of GC skew [(G – C)/(G + C)] for each DNA strand. Note that expression from tRNA and rRNA genes was forced to baseline to facilitate visualization of mRNA expression.


