
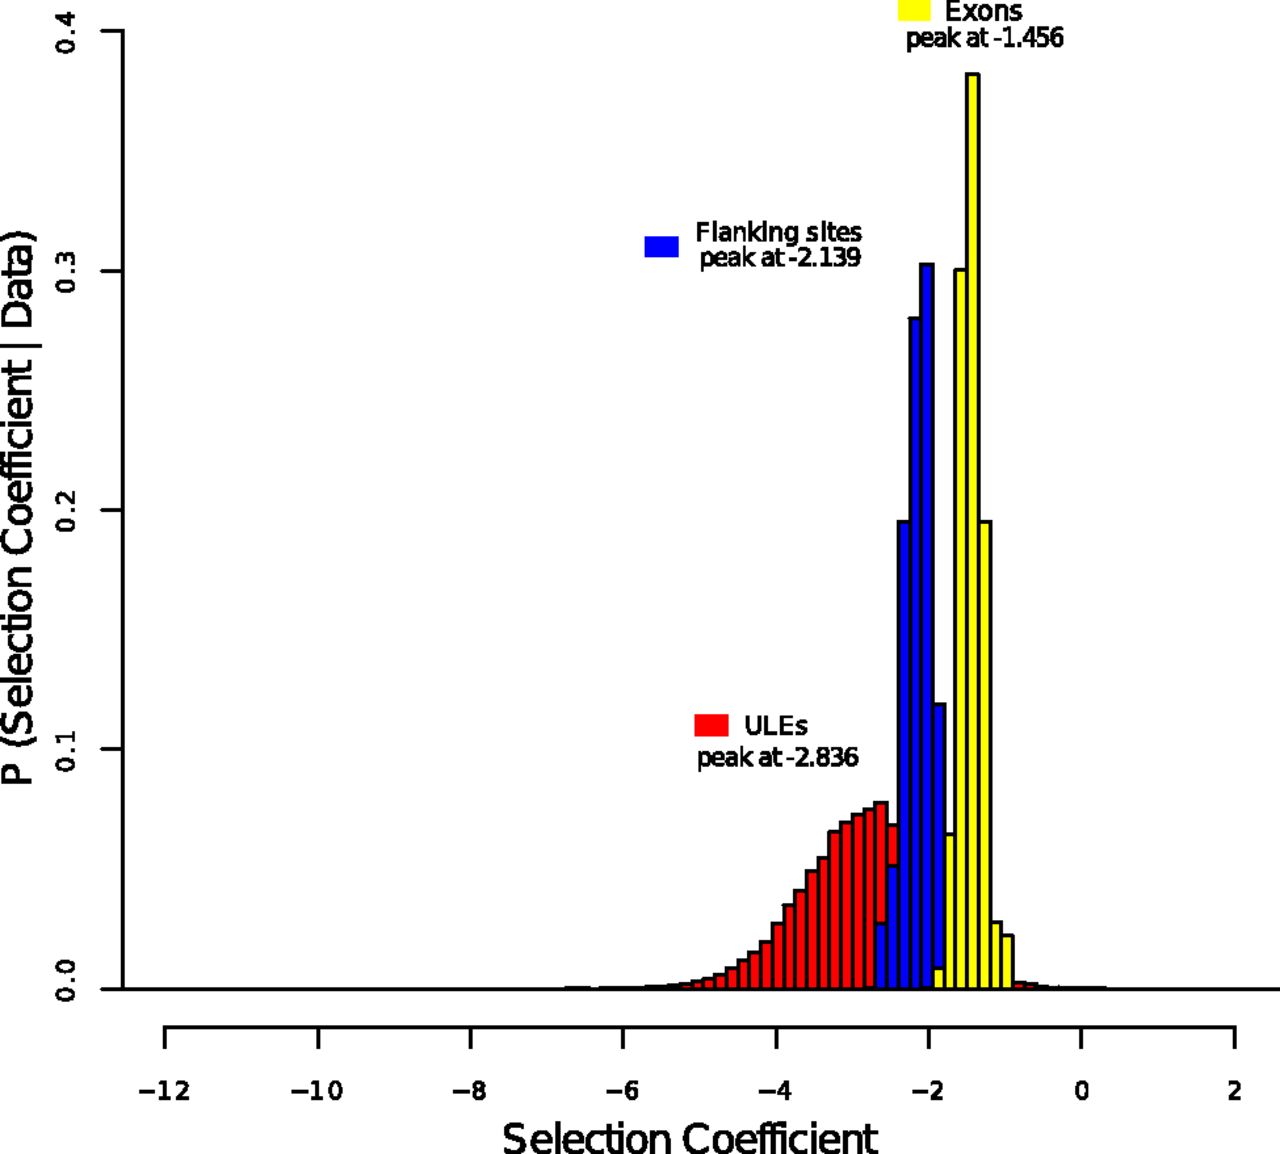
Figure 7.
Selection coefficients for genomic regions. Shown are the posterior distributions of mean selection coefficients across classes of sites in the Arabidopsis genome. The values shown are α, the mean population scaled selection coefficient (2Nes). The values given are the maximum a posteriori (MAP) estimates from our MCMC (Supplemental Figs. S2, S3).


