
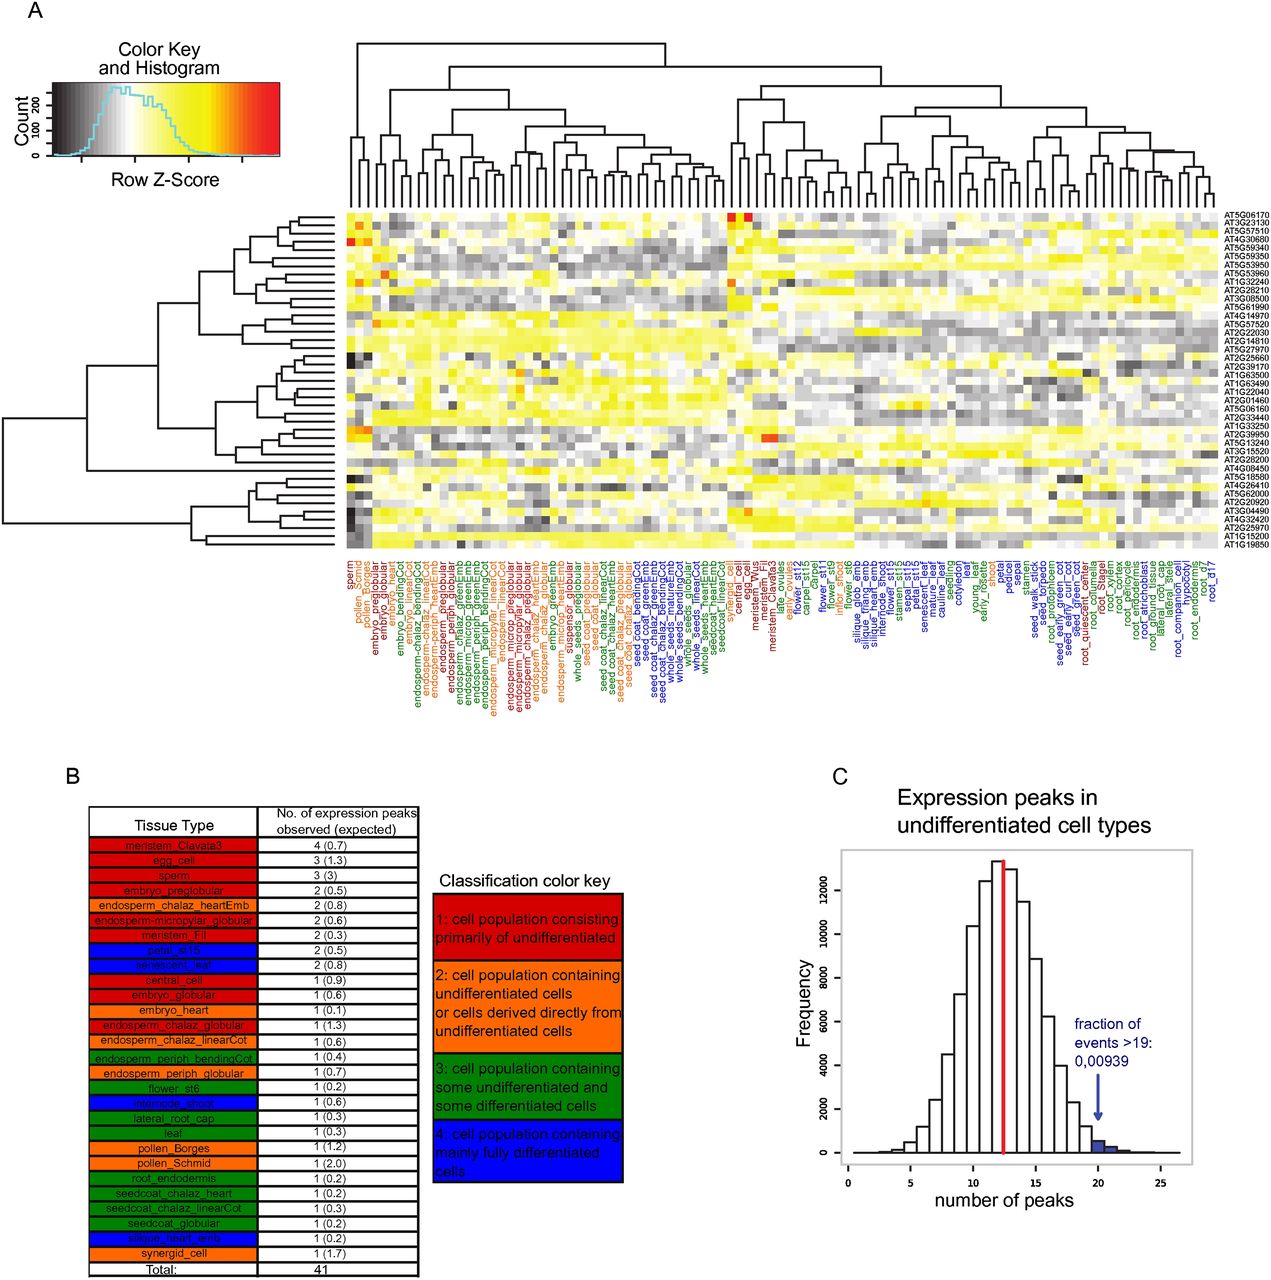
ULE-associated genes are developmentally regulated. (A) Heatmap representing color-coded relative expression among a large collection of Arabidopsis tissues/cell types. (Dark colors) Low expression; (bright colors) high expression. Expression values were scaled per row (i.e., per gene) to visualize expression peaks of a transcript across developmental stages. Per-gene as well per-tissue clustering was applied to visualize patterns in the expression profiles. Sample descriptions are color-coded as described in B. Only ULE-associated transcripts represented on the ATH1 array are shown (41/56). (B) Table of tissues in which expression peaks of ULE-associated genes occur. The color code indicates the differentiation state of the respective tissue/cell type. (C) ULE-associated gene expression peaks are significantly enriched in undifferentiated cells. The number of events where the maximal mean expression signal for one of 41 ULE-associated genes was found in undifferentiated cell types (i.e., gametes, shoot meristem cells, root quiescent center, and early embryo/endosperm) is significantly higher than expected by chance. The histogram depicts the frequencies of expression peaks occurring in undifferentiated cell types among groups of 41 genes randomly sampled from the whole array. Resampling of random groups indicated that the same or higher number of expression peaks in undifferentiated cell types occurs only in 939 out of 100,000 instances (P = 0.00939).


