
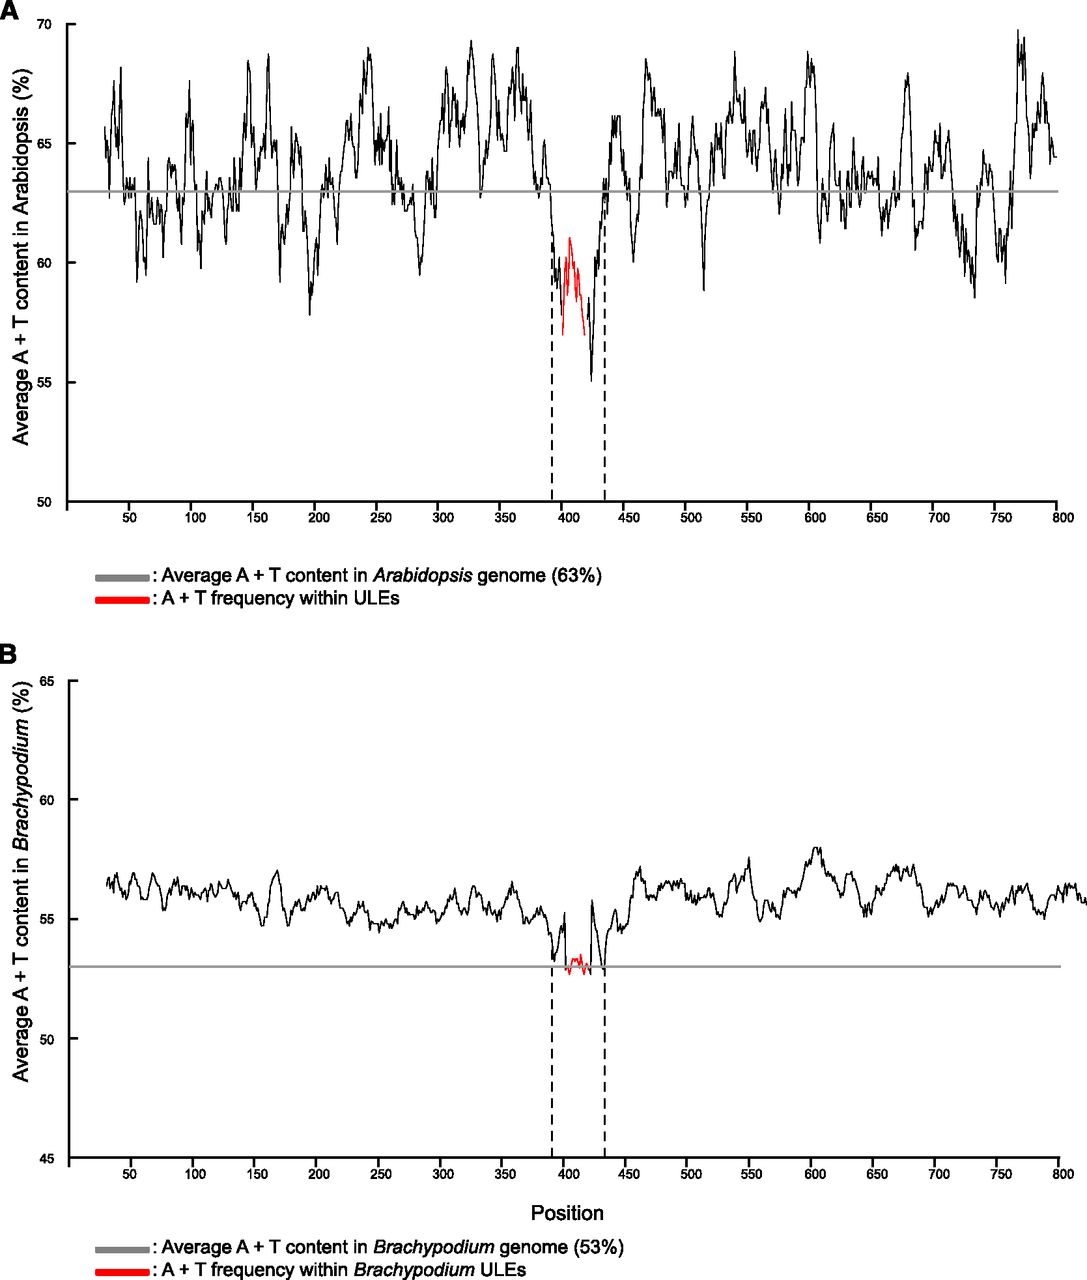
Figure 4.
A+T content distribution within ULEs and their flanking regions. (Red) A+T frequency within ULEs; (black) the frequency of flanking regions; (gray line) the average A+T content of the respective genome; (dashed vertical lines) the last nucleotide of the neighbor regions before ULEs. (A) A+T frequency in Arabidopsis ULEs (34/36). (B) A+T frequency in Brachypodium ULEs (869/870) present in the genomes of rice, sorghum, and maize, and their flanking regions.


