
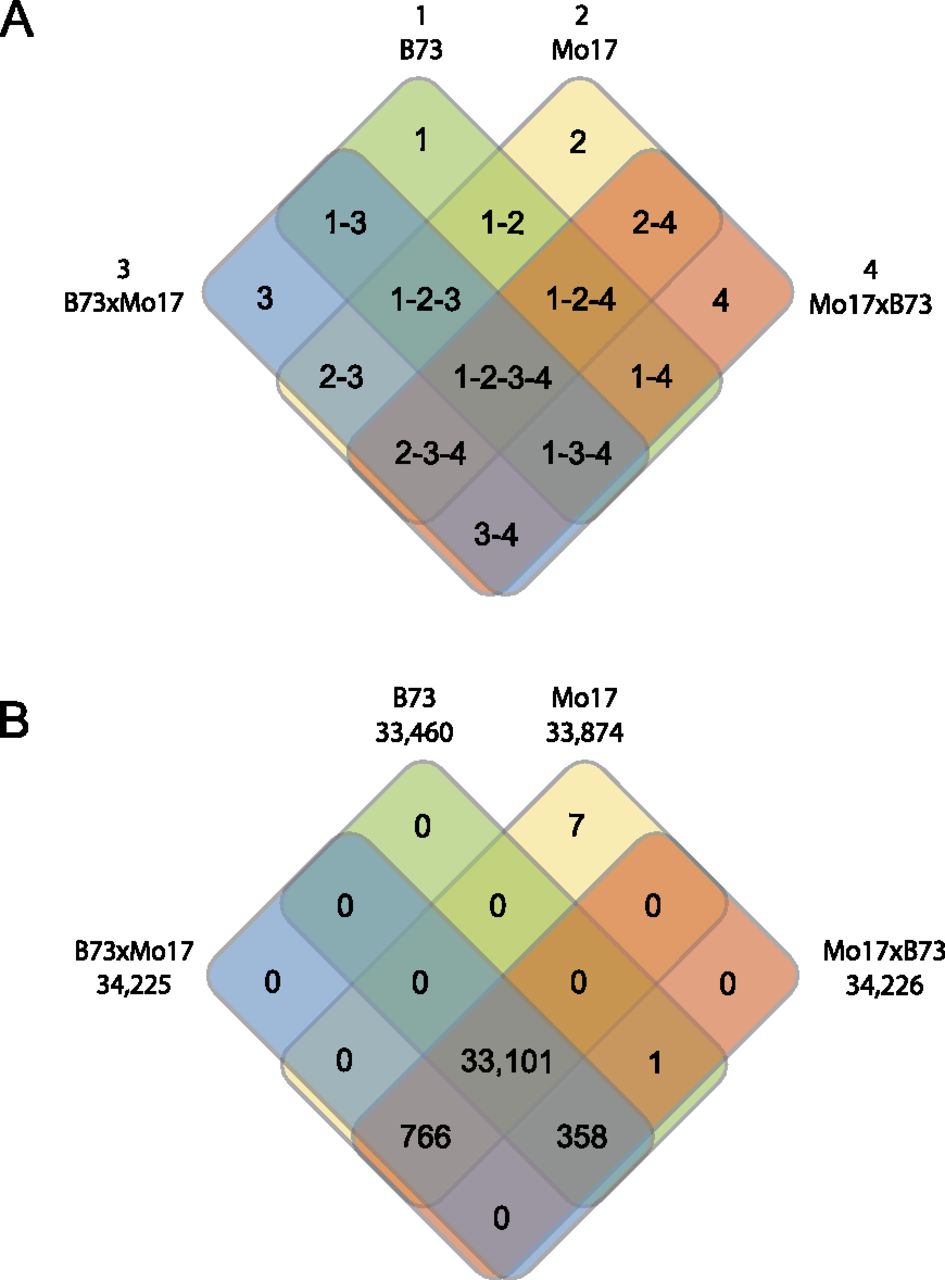
Figure 2.
Analysis of transcriptomic expression complementation by single parent expression (SPE) among the genes expressed in the two inbred lines. (A) The different genotypes are indicated with numbers 1–4, and each square field of the four-way Venn diagram represents a different expression class. (B) The numbers of genes of the various expression classes are indicated.


