
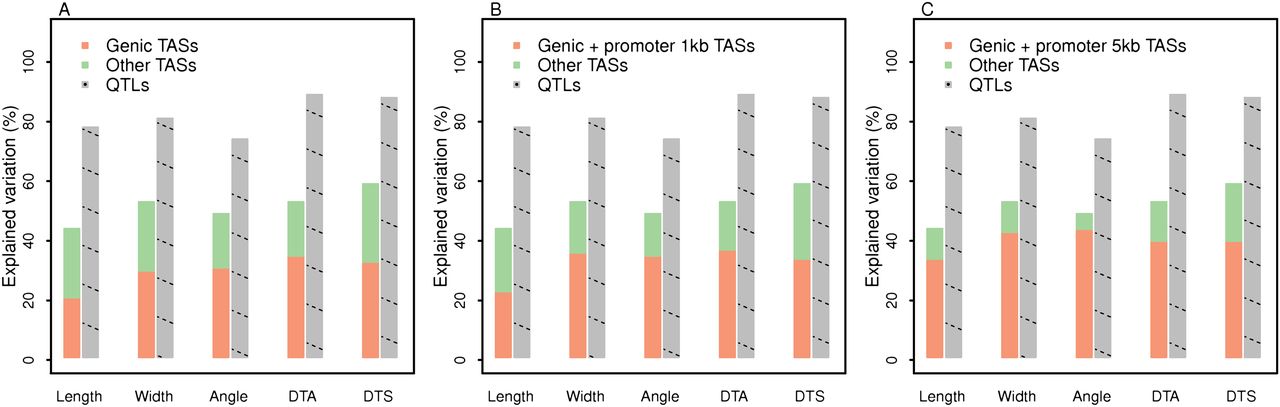
Figure 4.
Phenotypic variation explained by genic and nongenic TASs. (A) Genic TASs versus all other TASs; (B) genic region plus promoter 1kb versus all other TASs; and (C) genic region plus promoter 5kb versus all other TASs. Phenotypic variation explained by all QTLs is shown for comparison. TASs located within genic region plus upstream 5 kb comprise only 13% of the maize genome but explain a large proportion (67%–91%) of the phenotypic variation captured by all TASs.


