
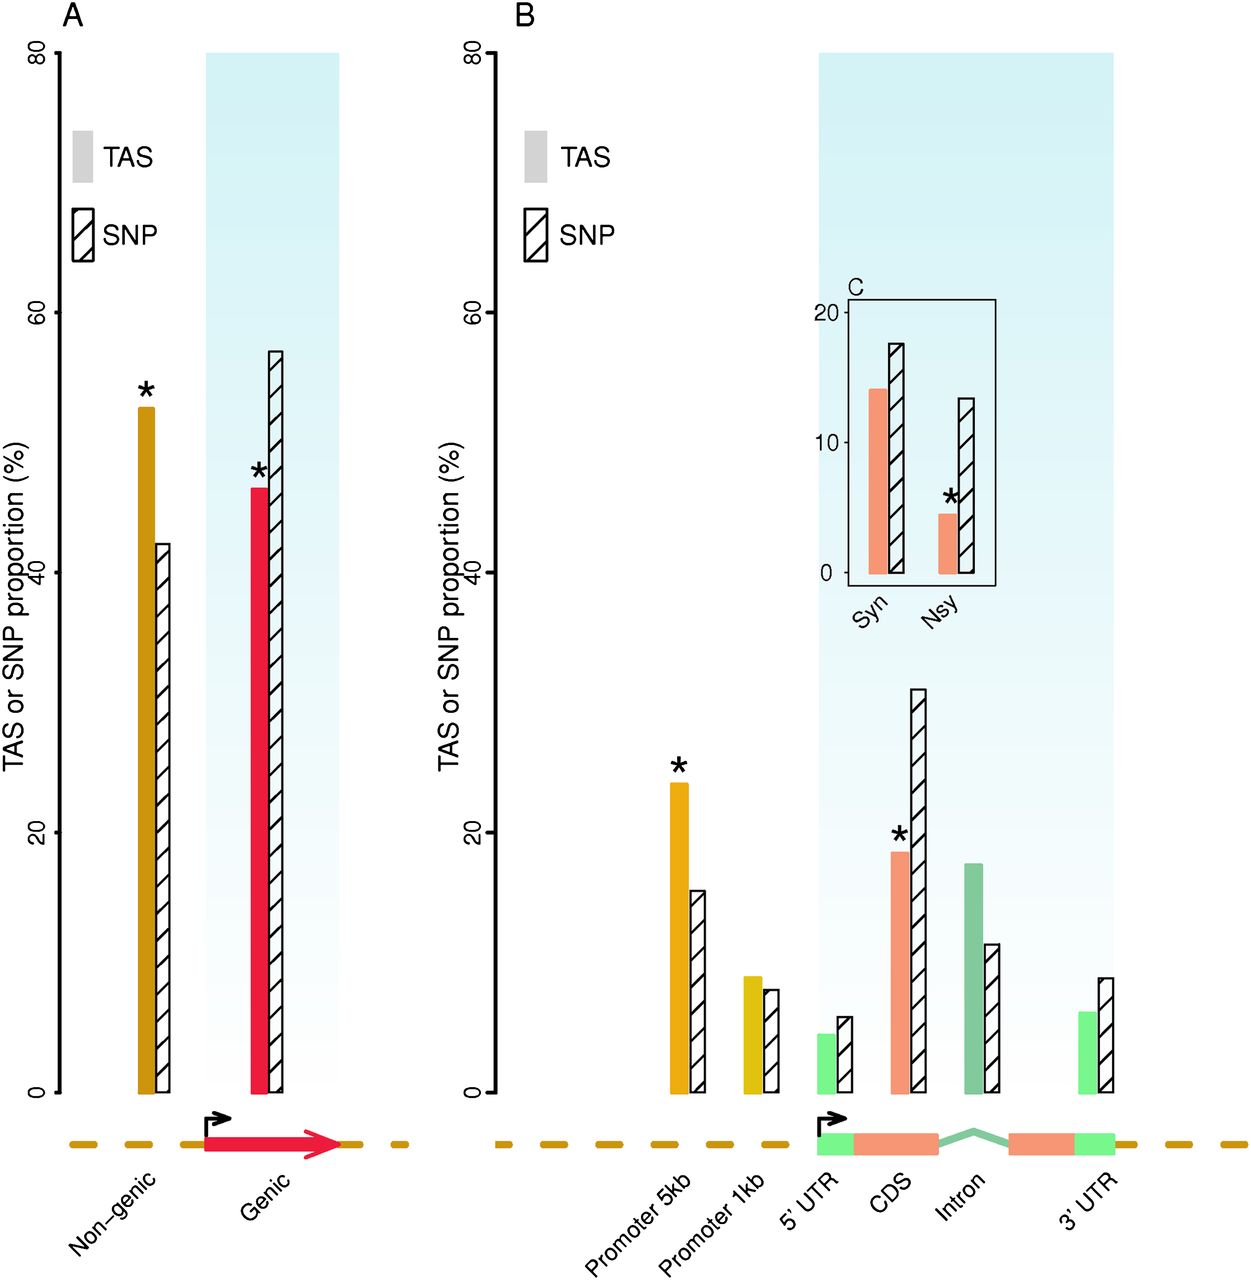
Distribution of TASs and tested SNPs for five quantitative traits across genomic annotation sets. (A) Nongenic versus genic (genic region is defined as from the transcription start site to the end of 3′ UTR); (B) different annotation sets; and (C) synonymous versus nonsynonymous. Genic plus 5-kb upstream regions comprise only 13% of the maize genome but account for 71% of TASs. Nongenic and promoter 5kb regions are overrepresented among TASs. The nonsynonymous set is underrepresented among TASs. Note that the nongenic region includes promoter 5kb, which in turn includes promoter 1kb, and the genic region includes the untranslated region (UTR), coding region (CDS), and intron. Stars denote that the proportion of TASs from the annotation set significantly differs from that of tested SNPs. (Arrow) Transcription start site.


