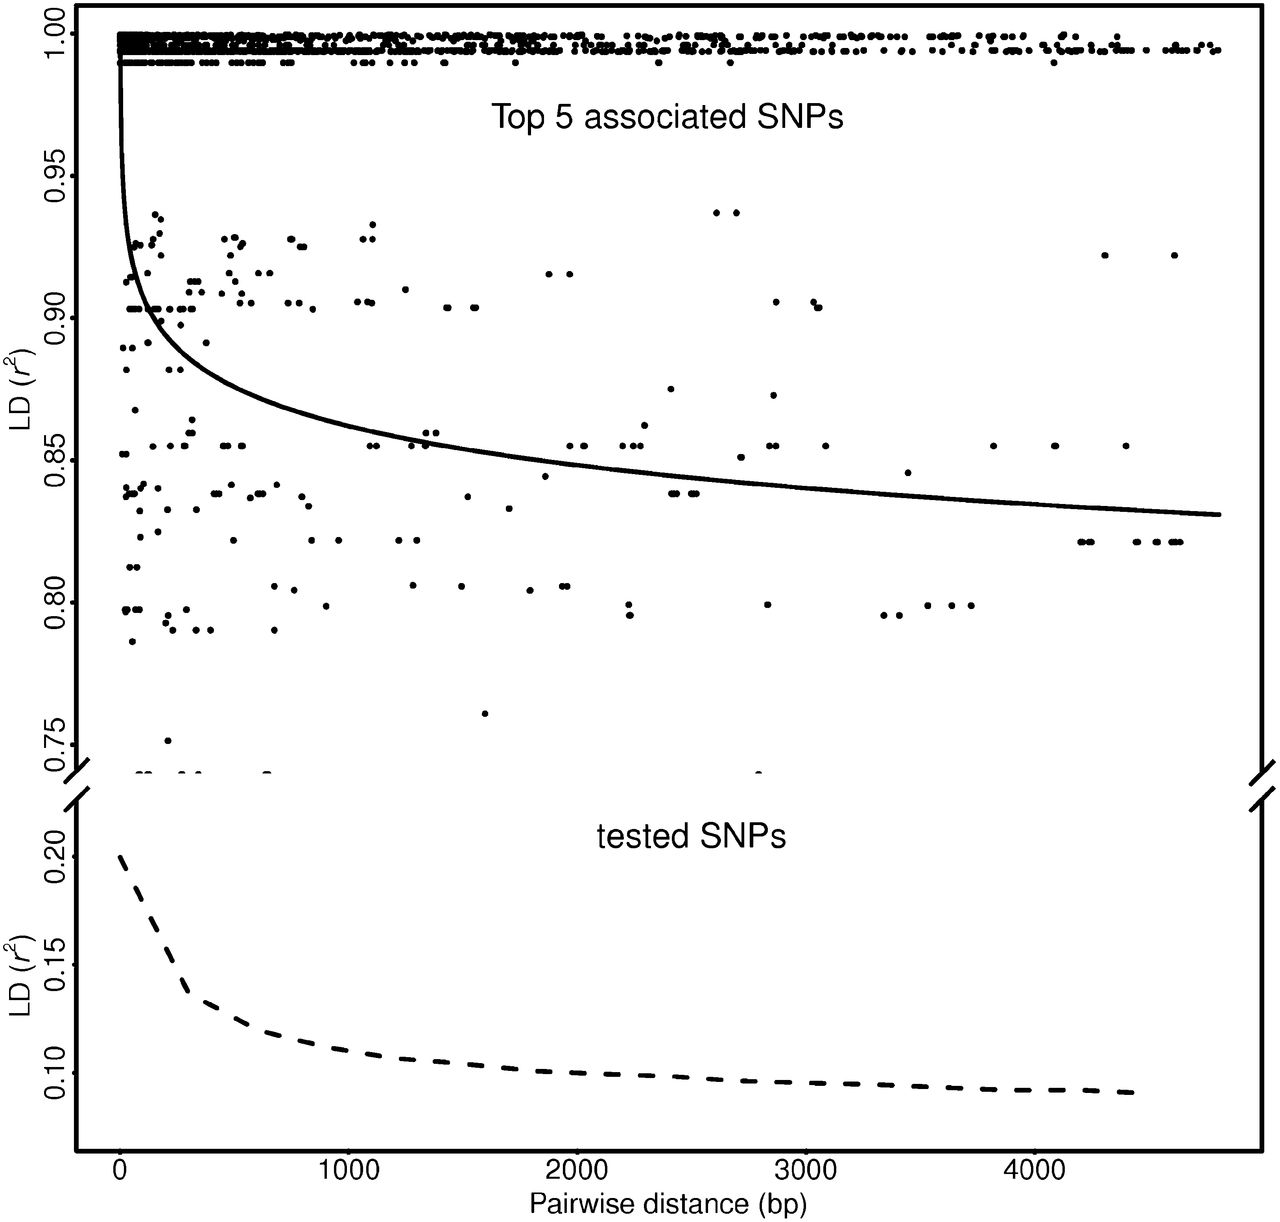
Genic and nongenic contributions to natural variation of quantitative traits in maize

(Downloading may take up to 30 seconds. If the slide opens in your browser, select File -> Save As to save it.)

Click on image to view larger version.

Figure 2.
Figure 2.

Linkage disequilibrium (LD) among the top five associated SNPs within each target region and the LD among all tested SNPs. A strong LD among top five associated SNPs and a plateau beyond 500–1,000 bp indicate that genomic regions signaled by TASs are well supported.

This Article

  1. Genome Res. 22: 2436-2444

Preprint Server