
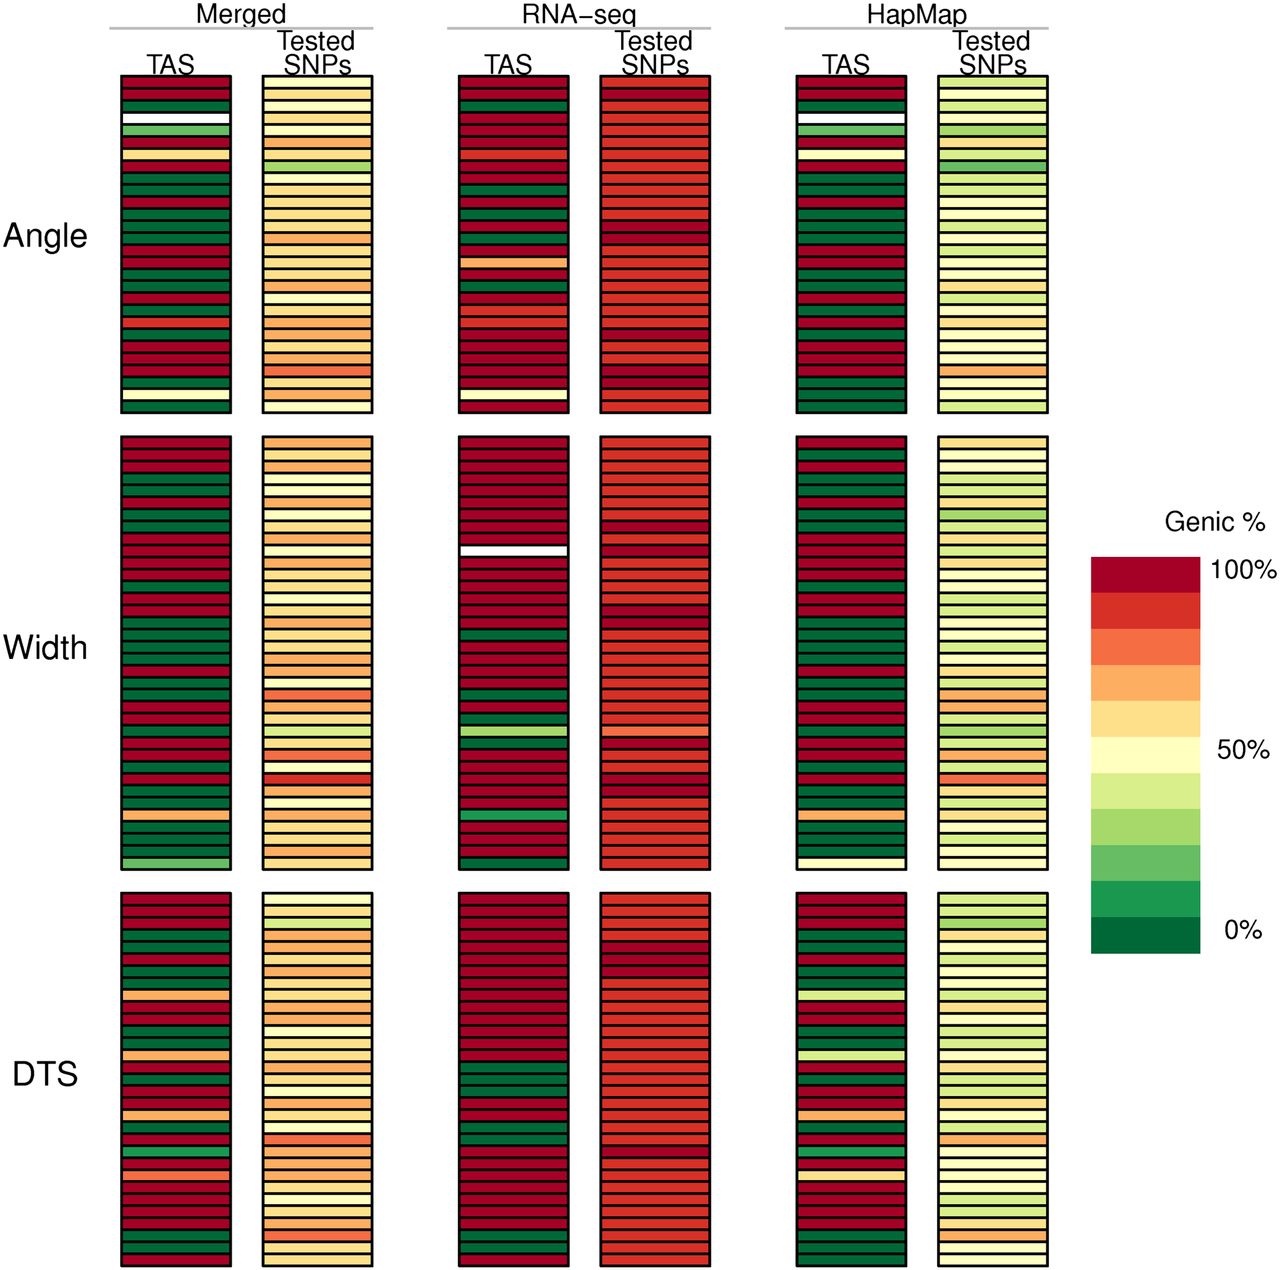
Genic or nongenic TASs for each dissected QTL region and the proportion of genic SNPs among all tested in the region. Genic region is defined as from the transcription start site to the end of 3′ UTR. With the merged data set, the probability of a TAS being genic or nongenic is significantly independent of whether more genic or nongenic SNPs in the target region are tested (P < 0.05) for all five traits. Each row represents a single QTL region for the indicated trait. Genic and nongenic TASs are equally likely to be identified for QTLs with large or small effects, which are sorted in descending order within each trait. (DTS) Days to silking.


