
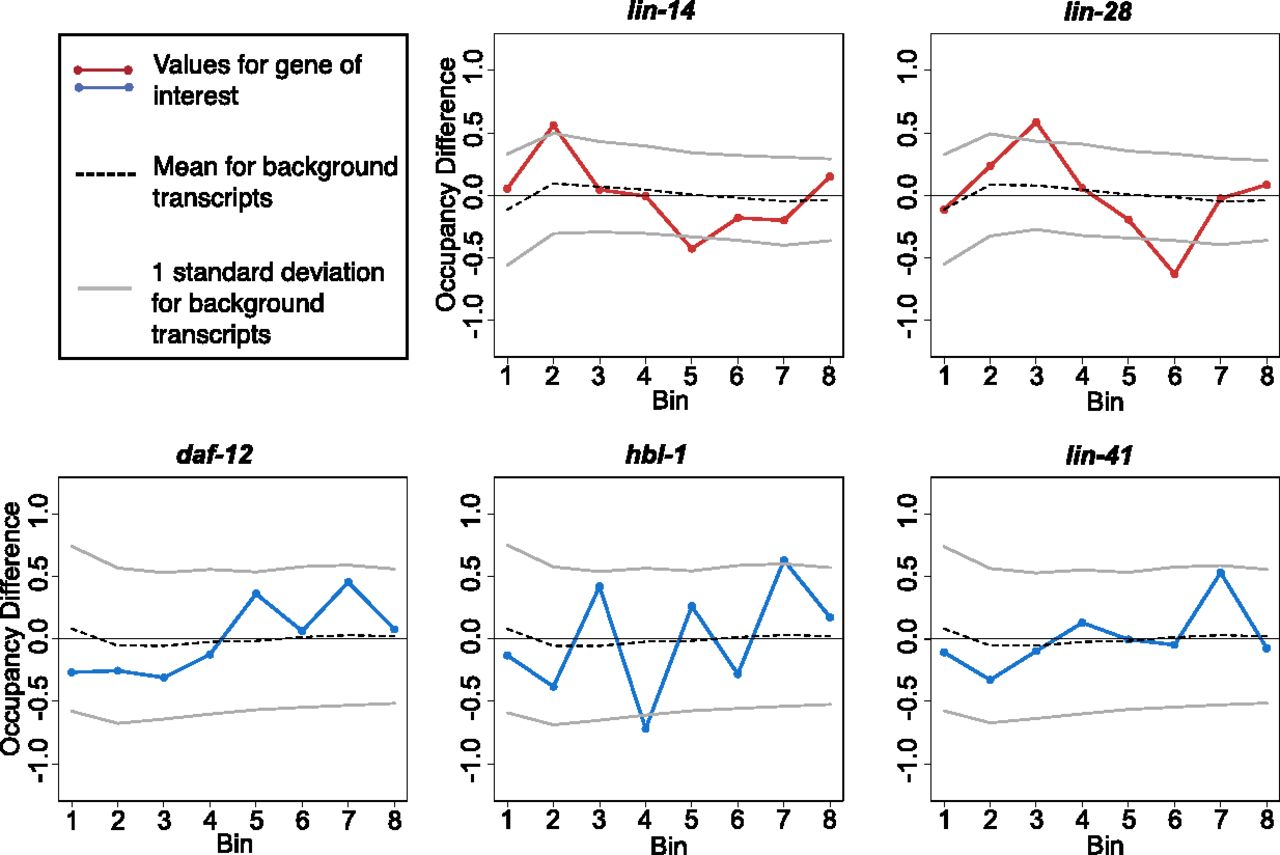
Ribosome occupancy profiles: gross changes. Each gene was divided into eight bins of equal length, and the relative occupancy of RPFs within each bin was calculated as a proportion of the total reads mapping to the gene within the sample that map to the bin. Occupancy for each bin was then compared between miRNA-unregulated and -regulated stages for miRNA targets (L1–L2 for lin-14 and lin-28, L2–L4 for hbl-1, daf-12, and L3–L4 for lin-41). The change for a given bin is the simple difference (regulated − unregulated), such that a positive score indicates the bin had greater occupancy in the miRNA-regulated stage. (Gray bars) Standard deviation of bin changes for mRNAs of similar coverage, with similar coverage defined as those genes with reads-per-codon values within 20% of the mRNA of interest.


