
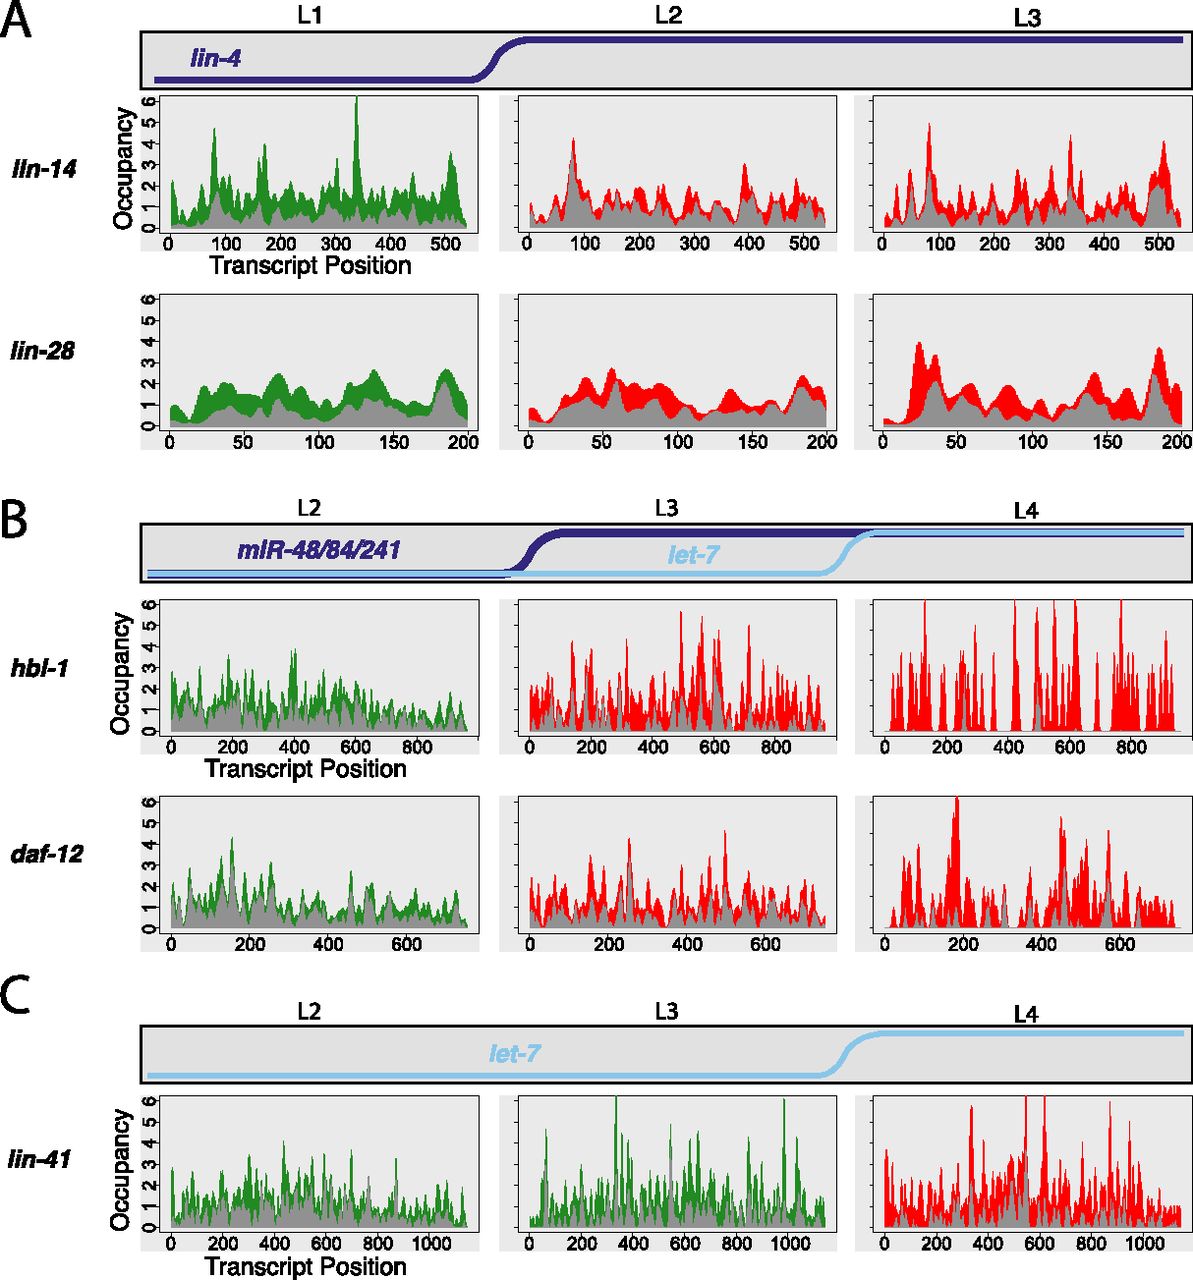
Ribosome occupancy profiles of miRNA targets. Stage-specific ribosome occupancy profiles are shown for targets of lin-4 (A), miR-48/miR-84/miR-241 (B), and let-7 (C). Occupancy profiles are generated by first assigning counts to each codon position in a transcript based on the number of RPF reads whose P-site falls on that codon (RPFs contain 12 nt 5′ to the P-site, see Ingolia et al. 2009; Stadler and Fire 2011). Occupancy values are then normalized within each data set by dividing the counts value at each position by the total counts for that transcript, then multiplying by the transcript length, such that the average codon value is one. Finally, individual profiles are smoothed using kernel density estimation. Data integrated from all replicate data sets are shown: The top of the gray region represents the minimum value observed at that position among all replicates, while the top of the colored region represents the maximum value observed. Equivalent non-smoothed and non-normalized plots are shown in Supplemental Figure S7.


