
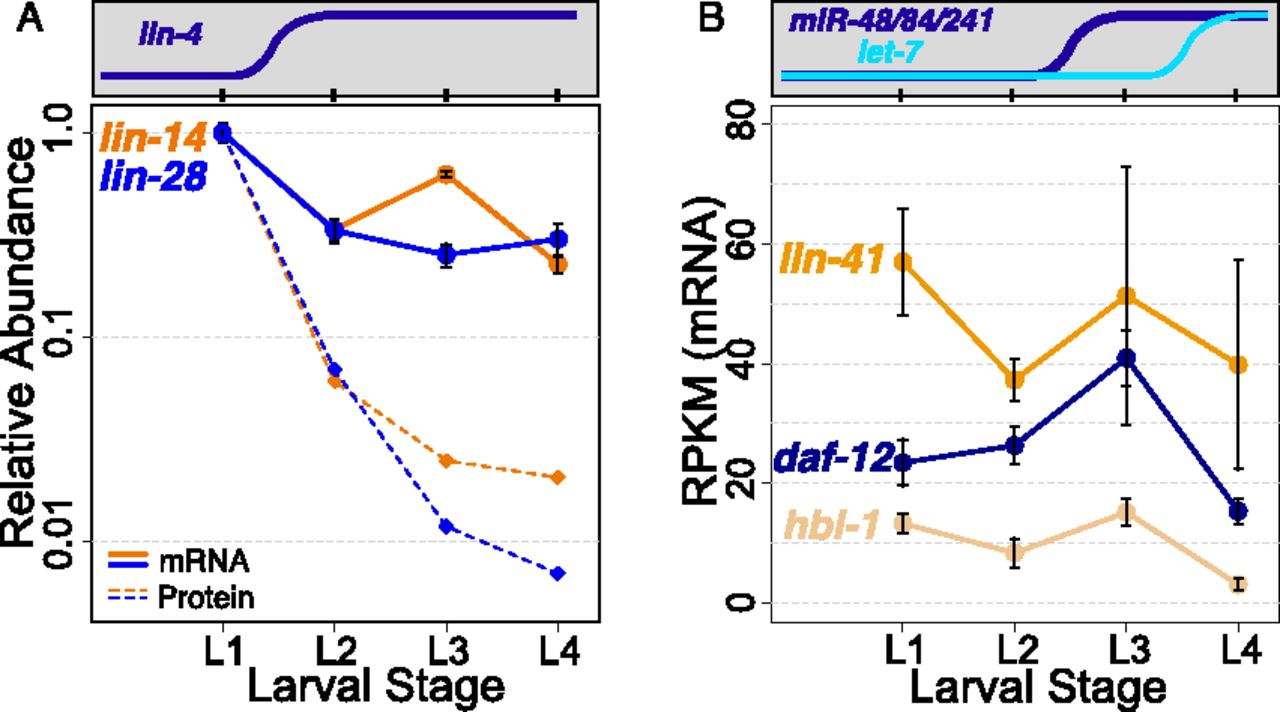
Changes in mRNA levels of miRNA targets measured by mRNA-seq. (A) Steady-state mRNA levels measured by mRNA-seq (solid lines) and protein levels (dashed lines) measured by immunoblotting for lin-4 targets (lin-14 and lin-28). mRNA and protein levels were normalized to L1 levels, and relative levels at subsequent larval stages were plotted on the same scale with a logarithmic vertical axis. (B) mRNA levels measured by mRNA-seq for let-7 and miR-48/miR-84/miR-241 targets (lin-41, daf-12, and hbl-1) for each larval stage, with nonlogarithmic vertical axis. Counts were normalized using the TMM method in the EdgeR package (Robinson and Oshlack 2010) to account for both library size and composition differences. (Data points) Average normalized tag count for all replicates at each stage; (error bars) standard error of the mean. Significance of differential mRNA levels across larval development (L1–L4) was determined by a two-sided t-test: lin-14 P = 0.07, lin-28 P = 0.05, lin-41 P = 0.21, hbl-1 P = 0.001, daf-12 P = 0.02. Additional normalizations are described in Supplemental Figure S2.


