
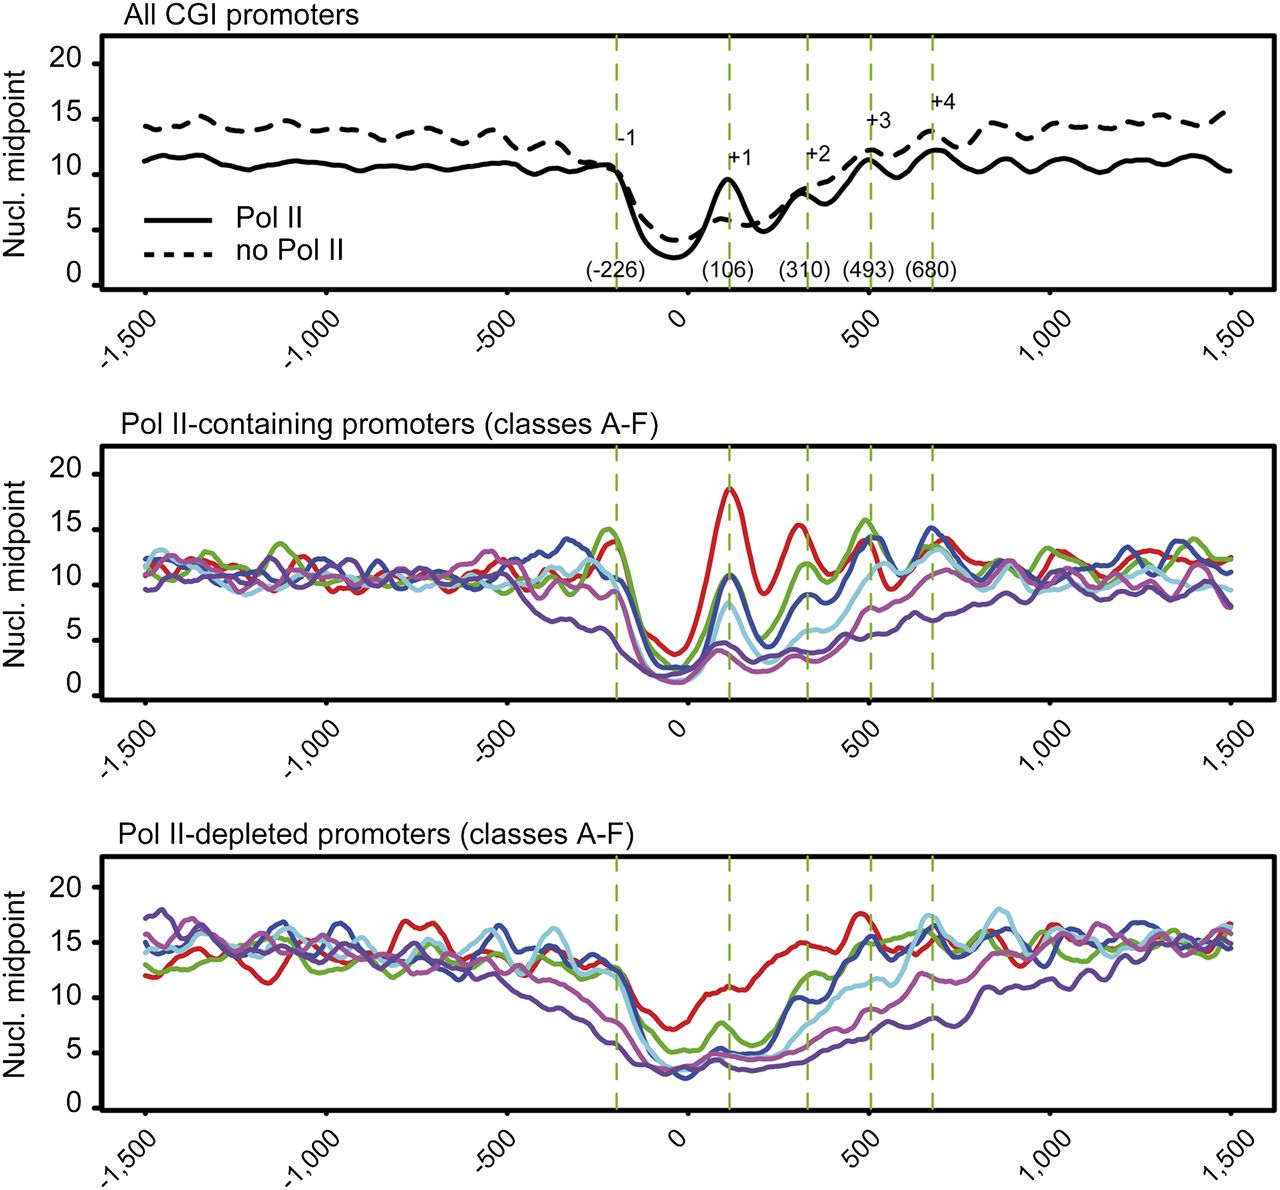
Figure 6.
Enhanced nucleosome positioning in Pol II–containing CGI promoters. Average positions of the −1 to +4 nucleosomes midpoint shown in Figure 5, A and B, are indicated on the top panel (all CGI promoters). Gene group colors A–F in the middle and bottom panels correspond to sextiles of increasing GC content. For Pol II–containing promoters, a clearer nucleosome periodicity as well as positioning is visible when compared with Pol II–depleted promoters.


