
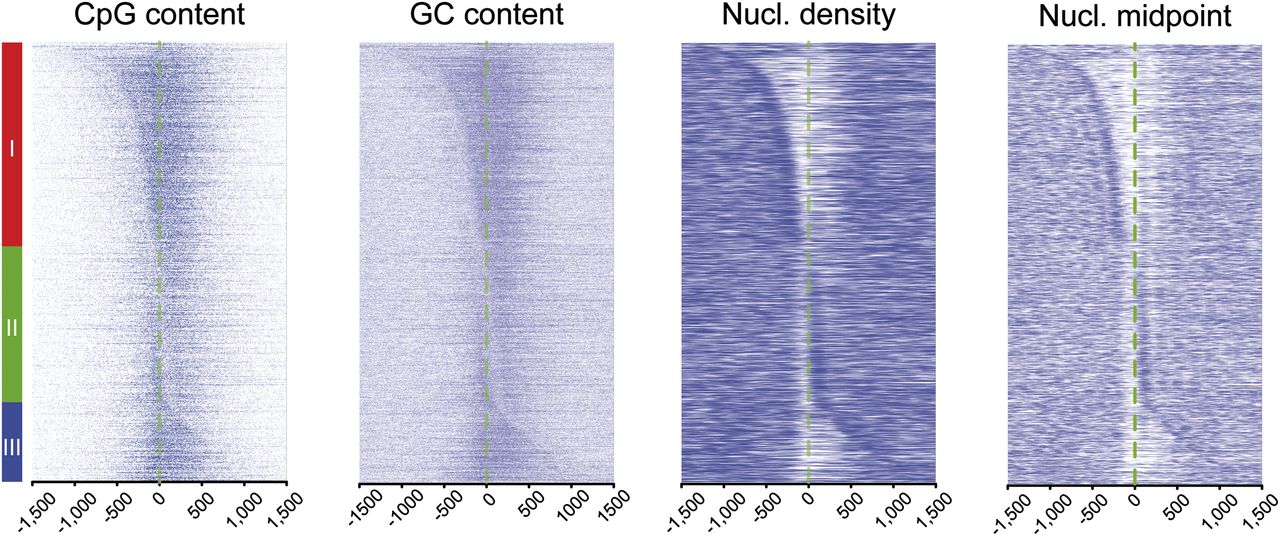
Figure 2.
Nucleosome position at the borders of CpG-rich areas in the three classes of Pol II–bound promoters. For the three classes of promoters defined in Figure 1, CpG and GC content are displayed side by side with nucleosome midpoints and densities. A more complete analysis of this cluster is also presented in Supplemental Figure 1.


