
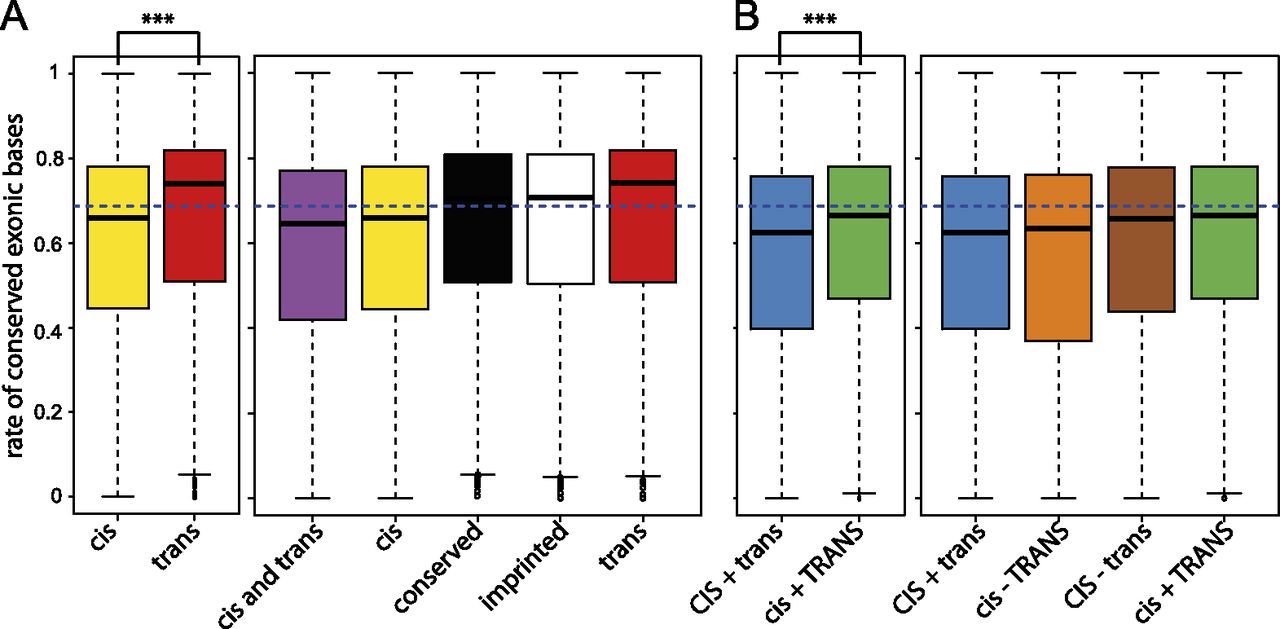
Exonic sequence conservation scores for the different classes of regulatory divergence. GERP conservation scores relative to all mammalian species in the Ensembl compara database were calculated for every exonic base. The proportion of bases above a GERP score of 1.4 in each exon was calculated for exons in each category. The mean conservation score for all exons is represented as a horizontal dashed blue line. (A) The conservation proportions for exons in the trans category are significantly higher than for genes in the cis category (P-value 9.7 × 10⁻⁷; t-test). Imprinted and conserved genes are also significantly more conserved than the cis and the cis and trans categories (Supplemental Table 10). (B) The cis and trans category is subdivided into four subcategories: cis and trans in the same direction with cis stronger (CIS + trans), cis and trans in the same direction with trans stronger (cis + TRANS), cis and trans in opposite directions with cis stronger (CIS − trans), and cis and trans in opposite directions with trans stronger (cis − TRANS). As in A, for the two categories where the cis and trans regulatory variants act in concert, the set of exons from genes for which the trans effect is stronger also show higher conservation than the set for which the cis effect is stronger (P-value 6.8 × 10⁻⁹; t-test). Supplemental Figures 10 and 11 show that the results do not change when different GERP conservation thresholds are used, or when promoter regions are considered.


