
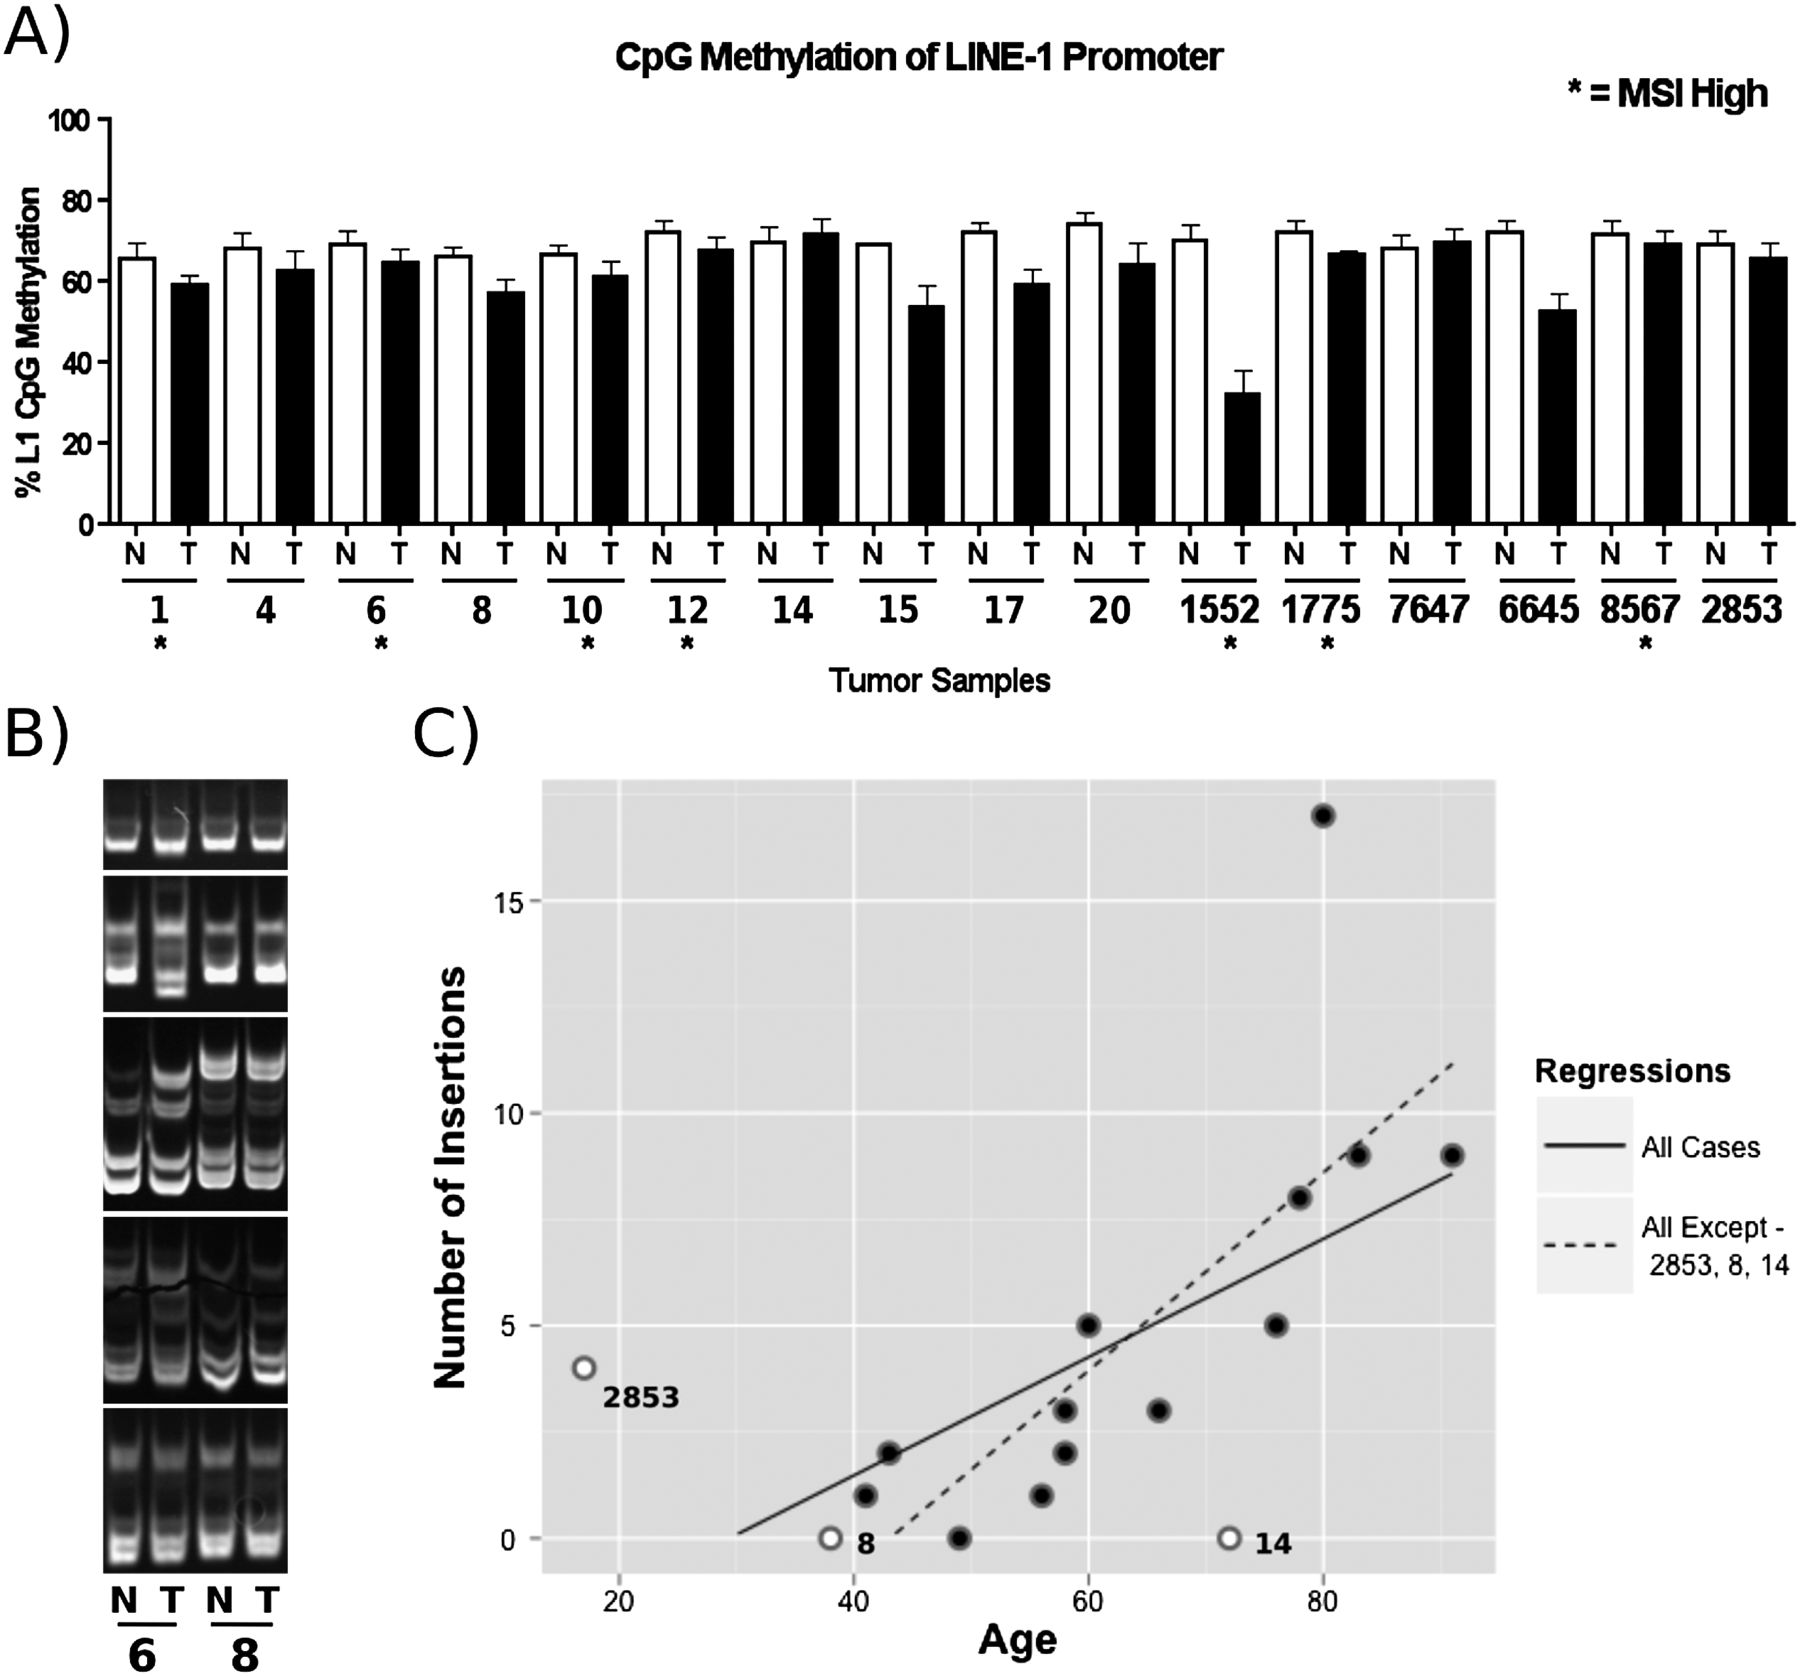
Analysis of factors influencing L1 activity. (A) L1 CpG promoter methylation status performed by quantitative bisulfite PCR analysis. (N) Normal tissue; (T) tumor tissue; (*) MSI. Replicates of four were done for each data point. (Error bars) Standard deviations. (B) MSI analysis. 6% TBE gel depicting the status of five microsatellite repeats (BAT25, BAT26, D2S123, D17S250, D17346 in descending order) in normal and tumor tissue from two different patients. Tumor tissue “6” contained additional bands and gel shifts compared with the normal tissue, indicating MSI. Samples from “8” demonstrated no differences suggestive of MSI. (C) Correlation of L1 activity with age of the patient at time of surgery. See text for details.


