
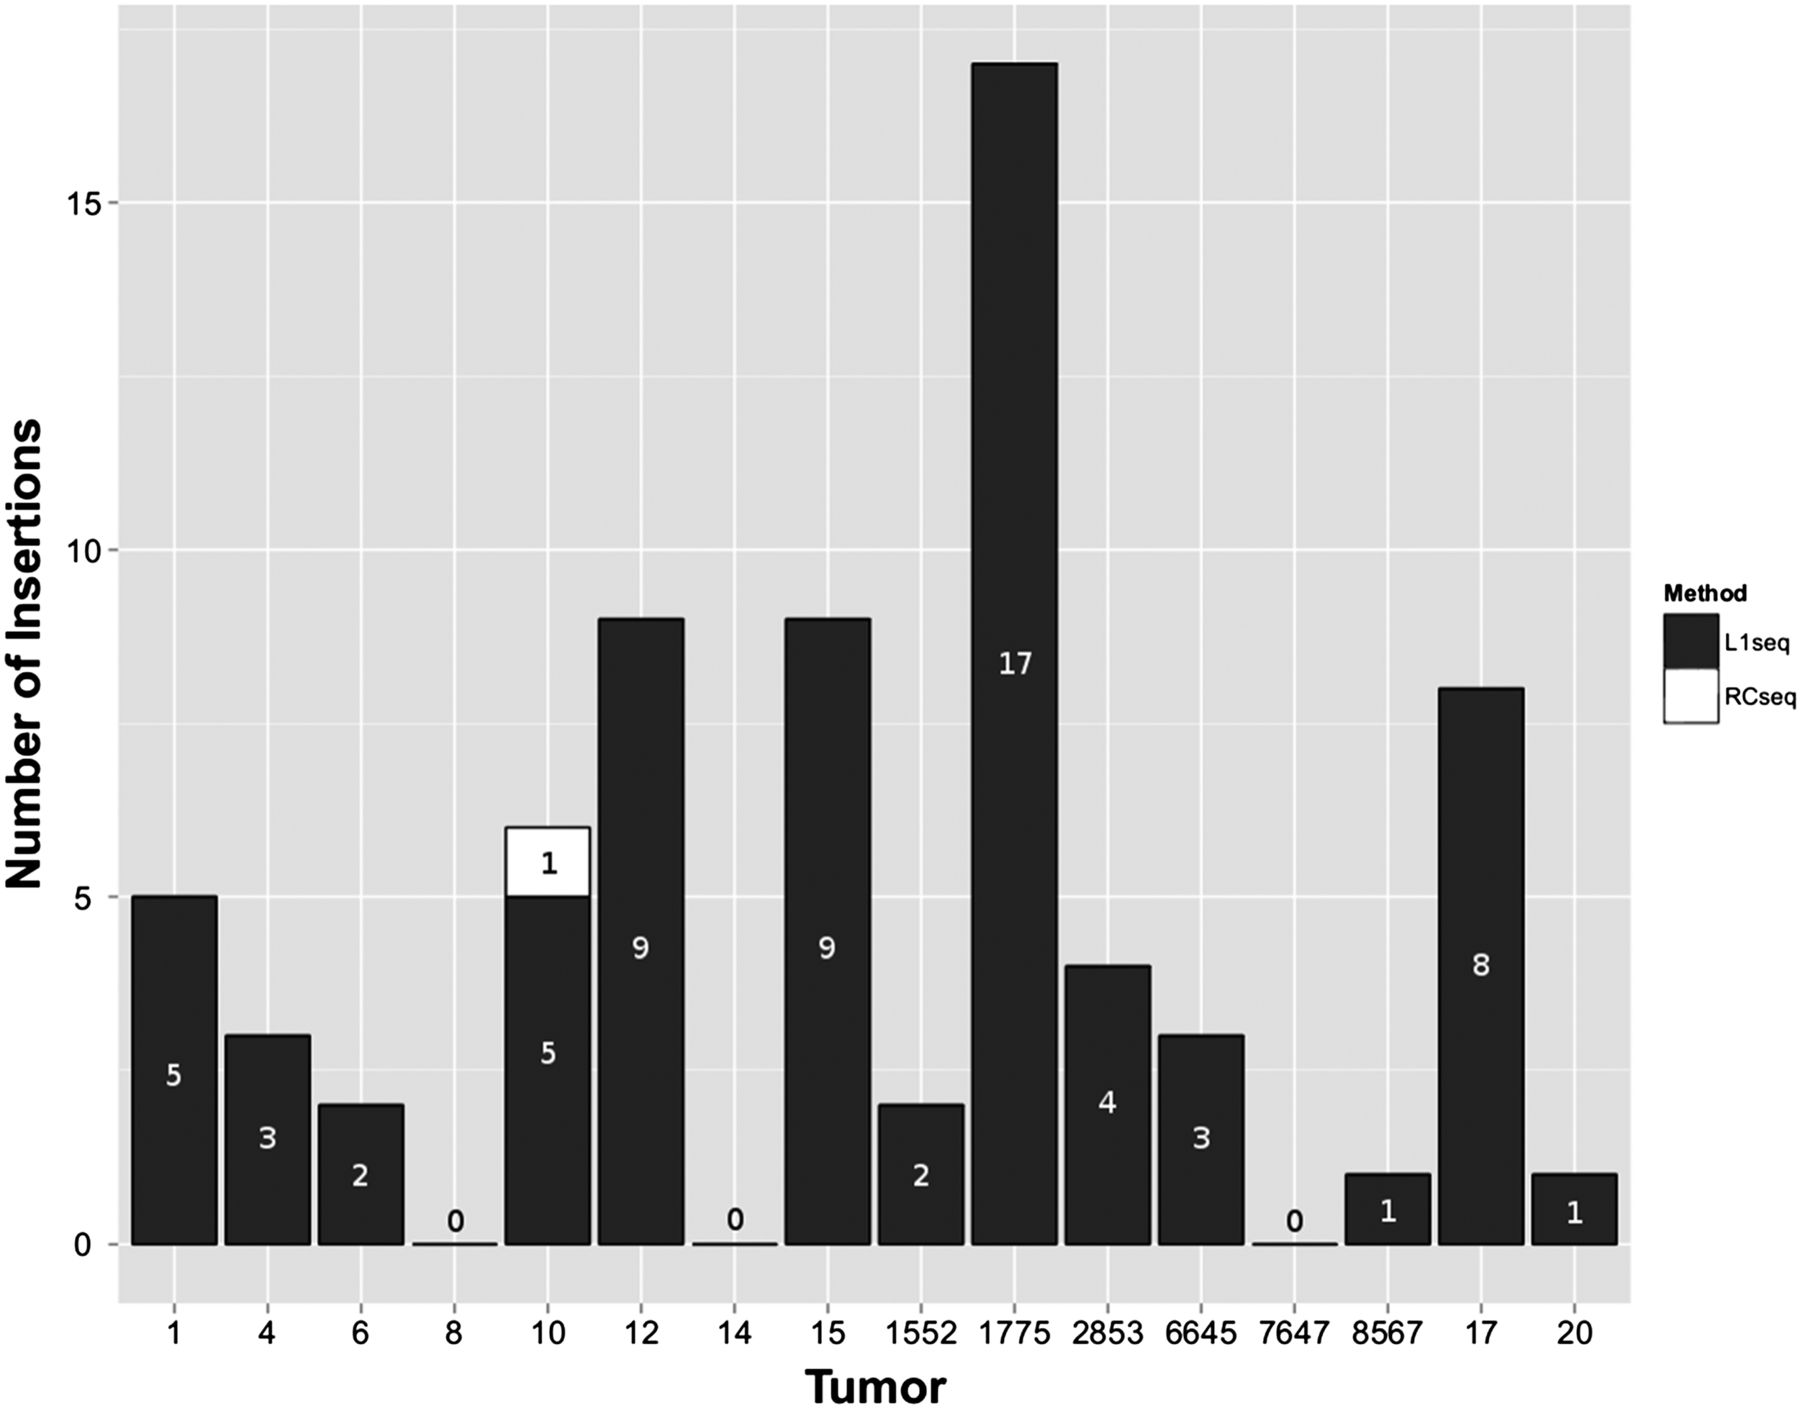
Figure 3.
Distribution of somatic L1 insertions in tumors. Insertions in black were detected by L1-seq, while the insertion in tumor 10 in white was detected by RC-seq only.
(Downloading may take up to 30 seconds. If the slide opens in your browser, select File -> Save As to save it.)
Click on image to view larger version.
Distribution of somatic L1 insertions in tumors. Insertions in black were detected by L1-seq, while the insertion in tumor 10 in white was detected by RC-seq only.
 CiteULike
 Delicious
 Digg
Digg Facebook
 Google+
 Reddit
 Twitter
