
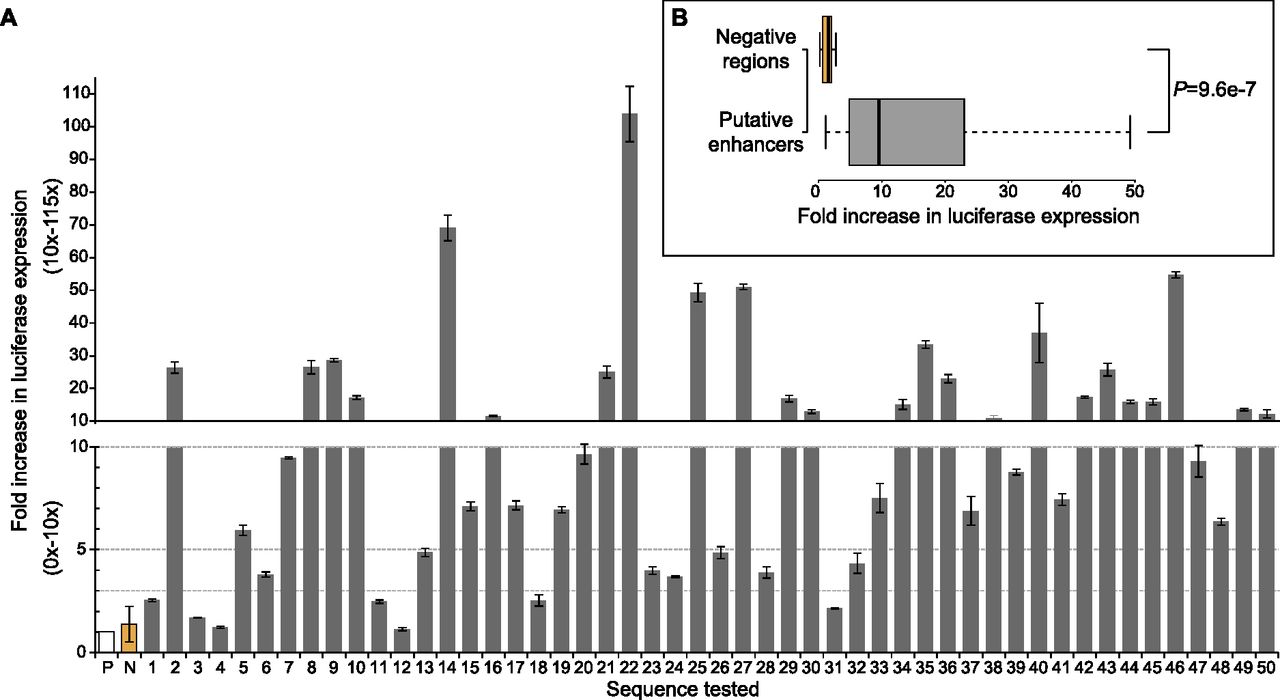
Putative melanocyte enhancers direct reporter expression in melan-a. (A) Fold increase in luciferase reporter expression directed by indicated sequence relative to promoter-only control (P; white bar). Gray bars show fold increase of randomly selected putative enhancers (numbered 1–50). N (orange bar) represents the average of 10 negative regions. (Error bars) SD of three biological replicates, except in the case of N, where error bars show the standard deviation of 10 different negative regions. Note the difference in scale between bottom panel (onefold to 10-fold by one) and top panel (10-fold to 115-fold by 10). (Dotted lines) 10-fold, fivefold, and threefold thresholds (top to bottom). (B) Box plot summarizing results of reporter assays for 10 negative regions (top, orange) and 50 putative enhancers (bottom, gray). P = 9.564 × 10⁻⁷ by two-tailed t-test. Four outliers in putative enhancer group not shown in box plot (nos. 14, 22, 27, 46).


