
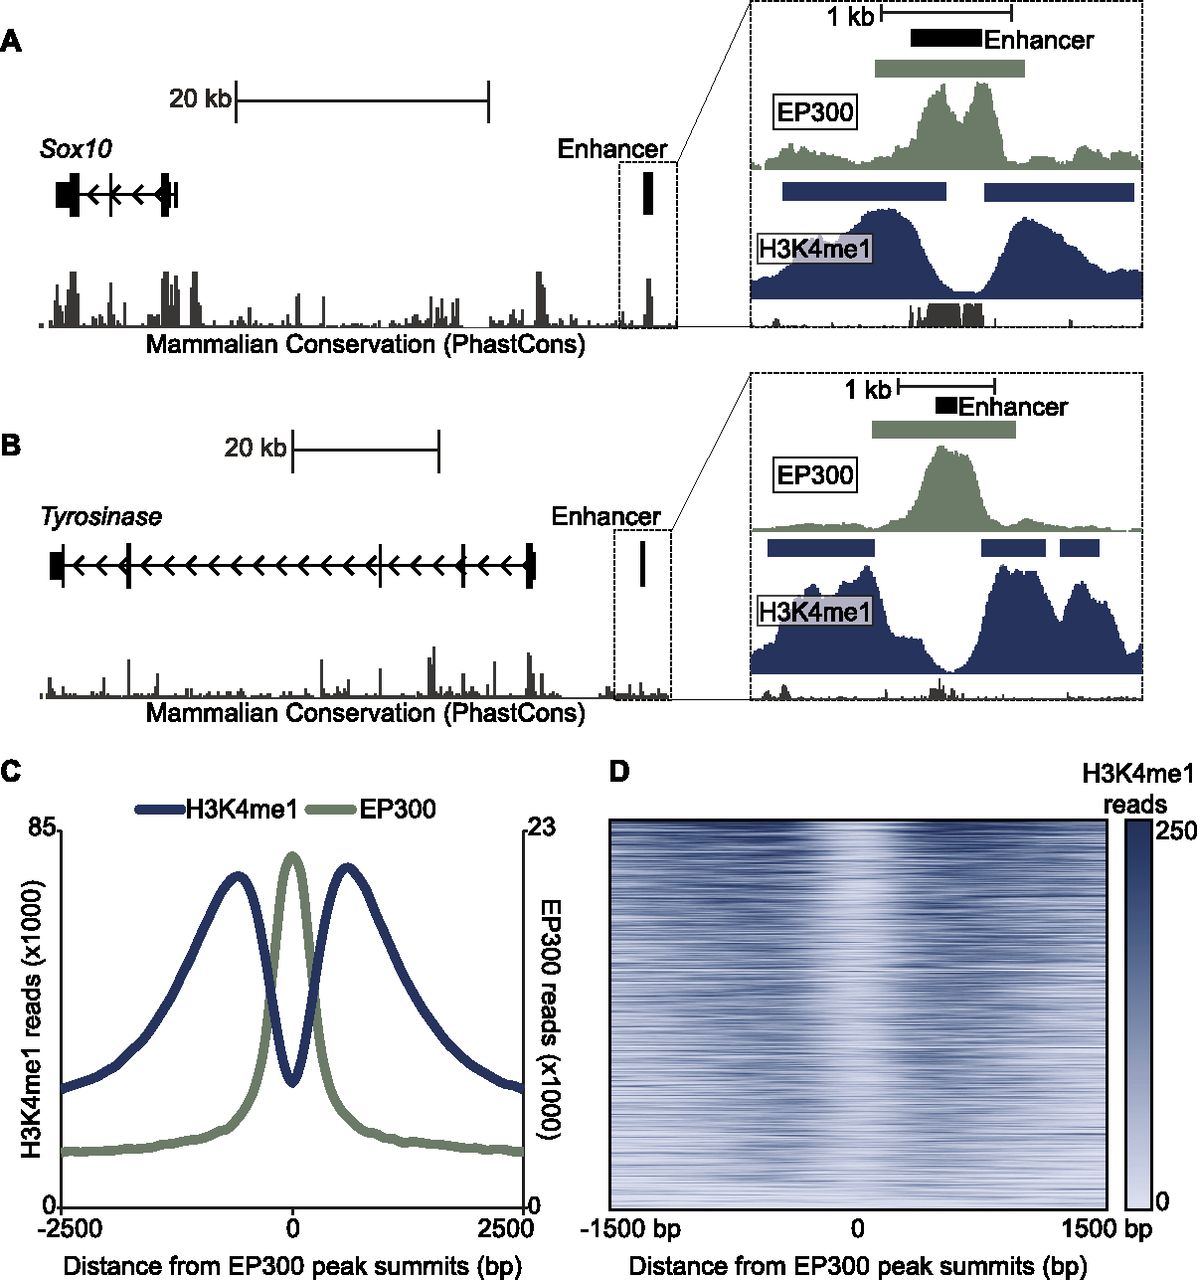
EP300 and H3K4me1 ChIP-seq signature at melanocyte enhancers. (A, left) Schematic of chr15:78,984,500–79,034,500 (UCSC Genome Browser; mm9) showing Sox10 and previously characterized melanocyte enhancer Sox10 MSC#5. (Right) Detailed view of the region immediately surrounding Sox10 MSC#5 (chr15:79030709–79033709), showing ChIP-seq data for EP300 (green) and H3K4me1 (blue) in melan-a. Rectangles are ChIP-seq peaks, and colored vertical bars below peaks show density of ChIP-seq reads in 10-bp bins. Gray bars at the bottom of inset show the phastCons score (Euarchontoglires). (B) Same scheme as in A, but showing the interval chr7:94,575,283–94,662,322 containing the Tyr gene and previously characterized melanocyte enhancer Tyr DRE-15kb. Interval shown to the right is chr7:94655287–94658287. (C) Number of ChIP-seq reads for H3K4me1 (blue, left axis) and EP300 (green, right axis) in a 5-kb window around the summits of 3622 EP300 peaks (averaged in 100-bp bins). (D) Heatmap showing the number of H3K4me1 ChIP-seq reads in a 3-kb window around 3,622 EP300 peaks.


