
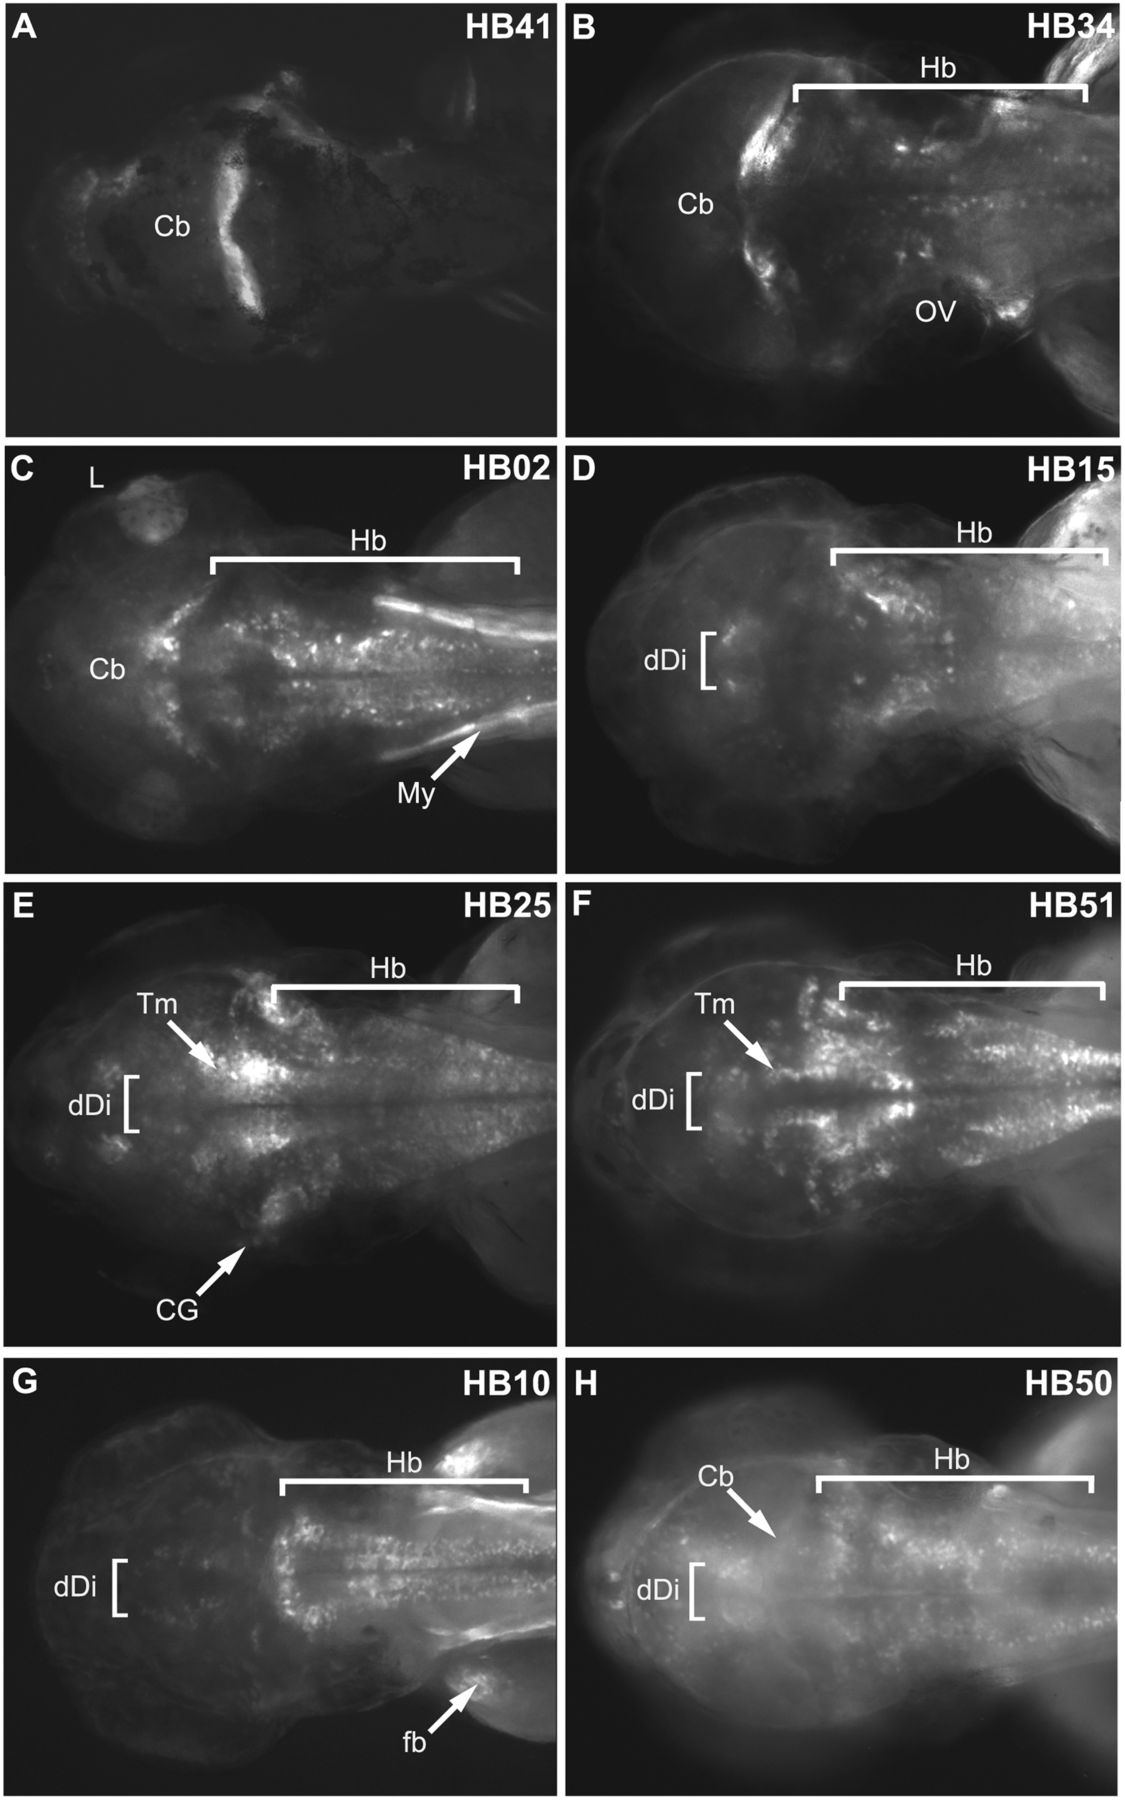
Figure 3.
Predicted enhancers display pleiotropic expression patterns in the hindbrain. (A–H) GFP reporter expression from eight stable lines corresponding to Hb predictions showing expression across the Hb as well as in some non-Hb domains. Dorsal view images were taken at 3 dpf (for lateral images, see Supplemental Figures), anterior to the left. (A) HB41, (B) HB34, (C) HB02, (D) HB15, (E) HB25, (F) HB51, (G) Hb10, (H) HB50. (Cb) cerebellum; (OV) otic vesicle; (Hb) hindbrain; (L) lens; (My) myotome; (dDi) dorsal diencephalon; (Tm) tegmentum; (CG) cranial ganglia; (fb) fin bud.


