
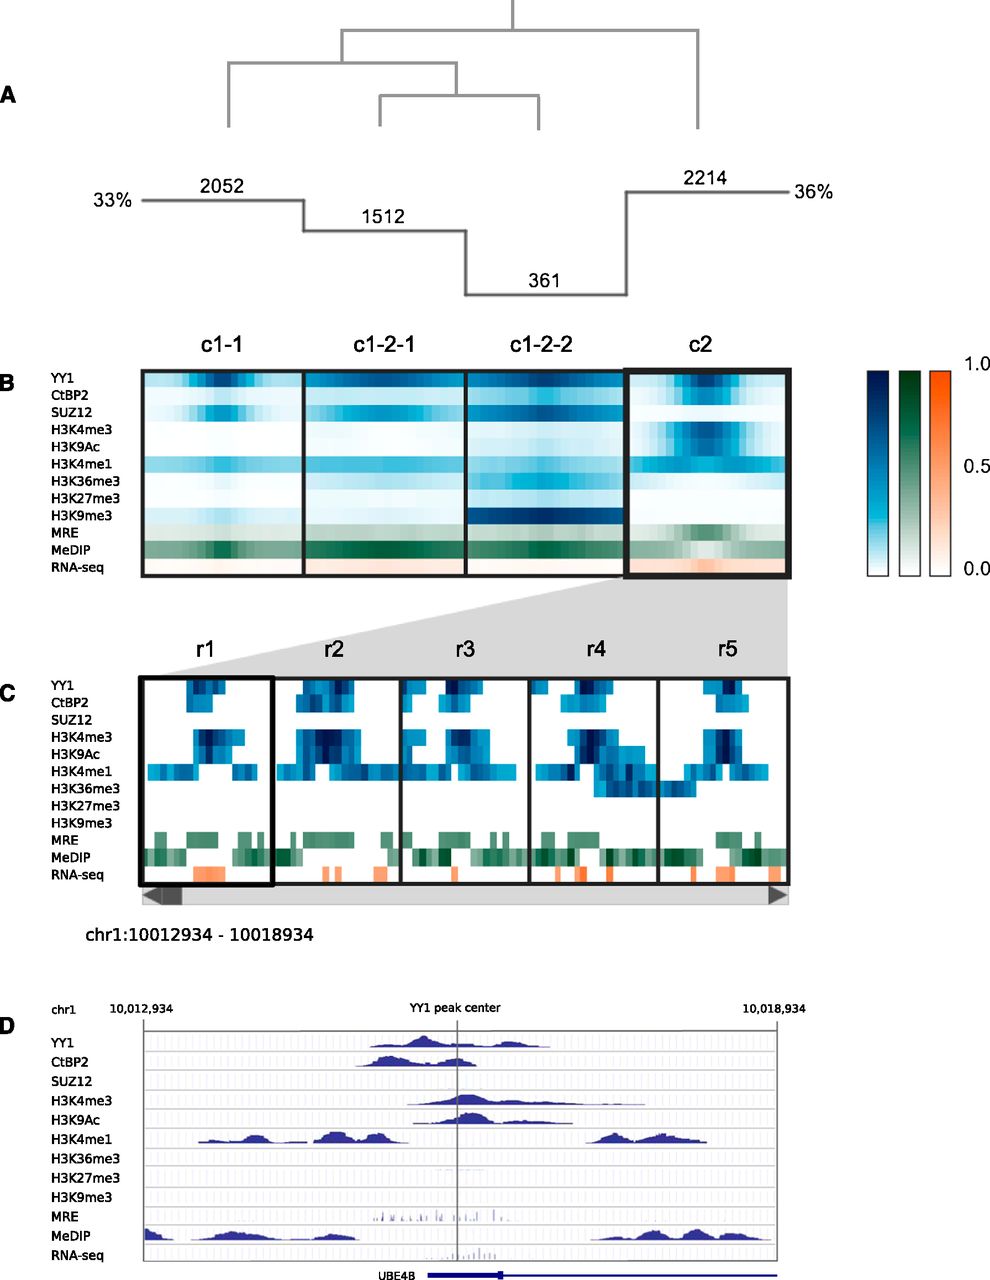
Clustering analysis of YY1 binding sites. (A) Histogram indicates the number of regions in each cluster, and the overlaid dendrogram traces the interactive cluster splitting events. (B) ChIP-seq data for YY1, CTBP2, SUZ12, and histone modifications (blue) together with MRE-seq and MeDIP-seq (green) and RNA-seq (orange) data from H1 hESCs were clustered using a bin size of 300 bp across 6-kb windows centered on sites of YY1 ChIP-seq enrichment. (C) Scrollable region browser: Data from individual regions within the currently selected cluster (c2) can be interactively viewed (five regions displayed at one time, r1–r5). (D) A context menu provides a hyperlink to the corresponding region display within the UCSC Genome Browser (view of r1 shown).


