
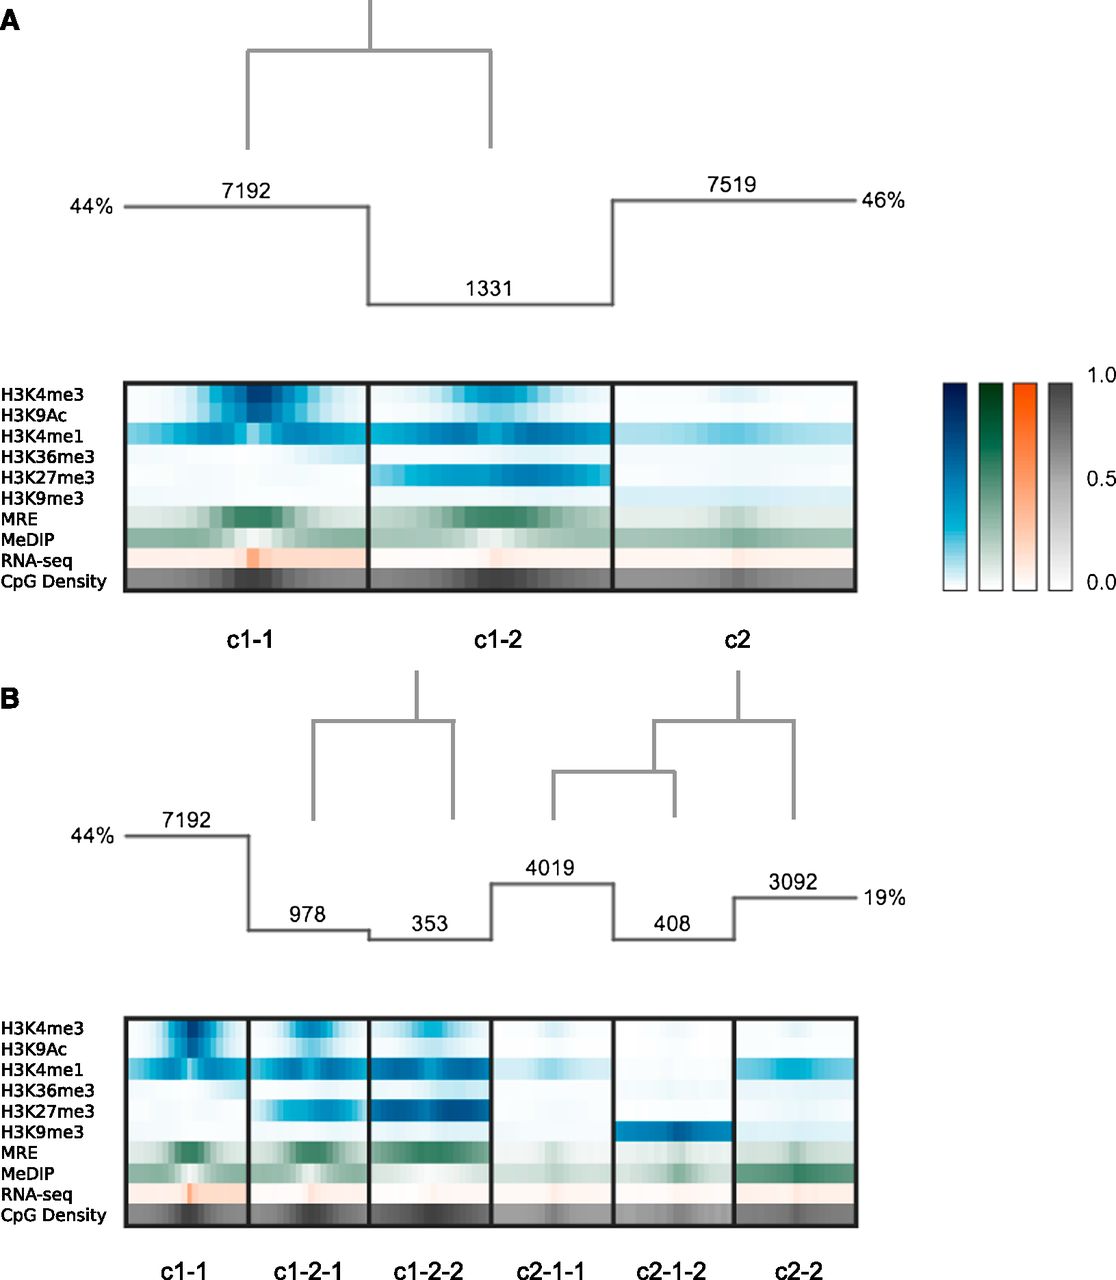
Clustering analysis at annotated TSSs. (A) Histogram indicates the number of regions in each cluster, and the overlaid dendrogram traces the interactive cluster splitting events (initial clustering with k = 2, followed by one manual split of cluster c1 into c1-1 and c1-2). Chromatin modification (blue), DNA methylation (green; MeDIP and MRE indicate methylated and unmethylated CpGs, respectively), and RNA-seq (orange) data from H1 hESCs together with genomic CpG density values (gray) were clustered using a bin size of 300 bp across 6-kb windows centered on RefSeq transcriptional start sites (TSSs). (B) Further exploration and interactive refinement of the clusters from A.


