
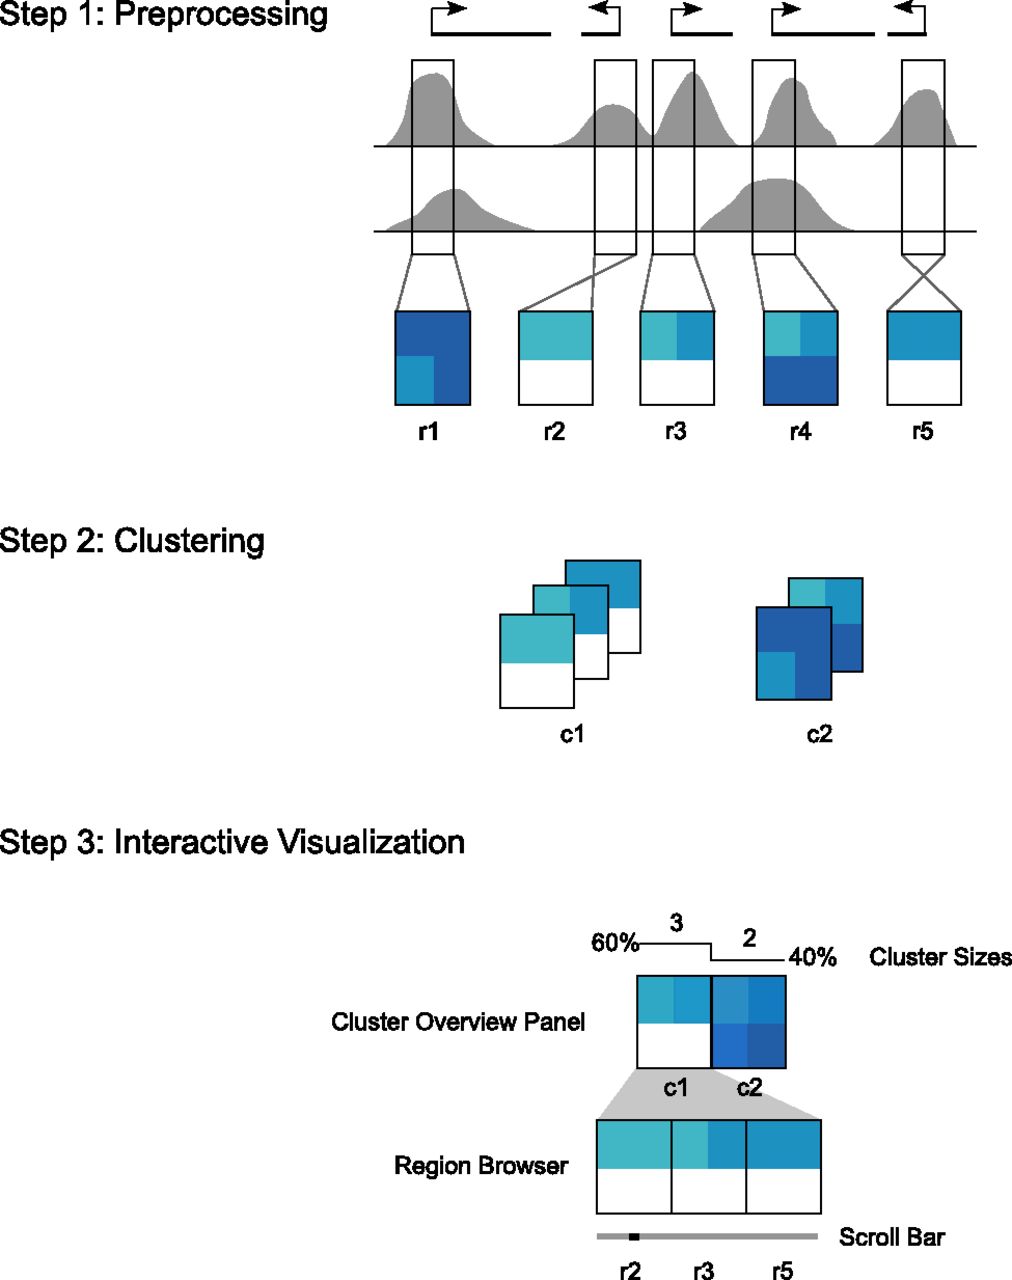
The Spark workflow. In step 1, the user's input data and regions of interest are preprocessed to enable rapid data retrieval in later steps. (Gray) Data enrichment peaks for two data samples; (vertical black boxes) user's regions of interest (r1–r5) centered on transcriptional start sites (TSSs). A data matrix is extracted for each input region and oriented according to strand. Rows in these matrices correspond to data samples, while the columns represent data bins along the genomic x-axis; two bins per region are used in this diagram. The values are then normalized to be between 0 and 1, represented here by white and dark blue, respectively. In step 2, the matrices are clustered. k = 2 in this diagram, resulting in two clusters (c1 and c2). In step 3, the clusters and their region members are viewed in the Spark interactive visualization interface.


