
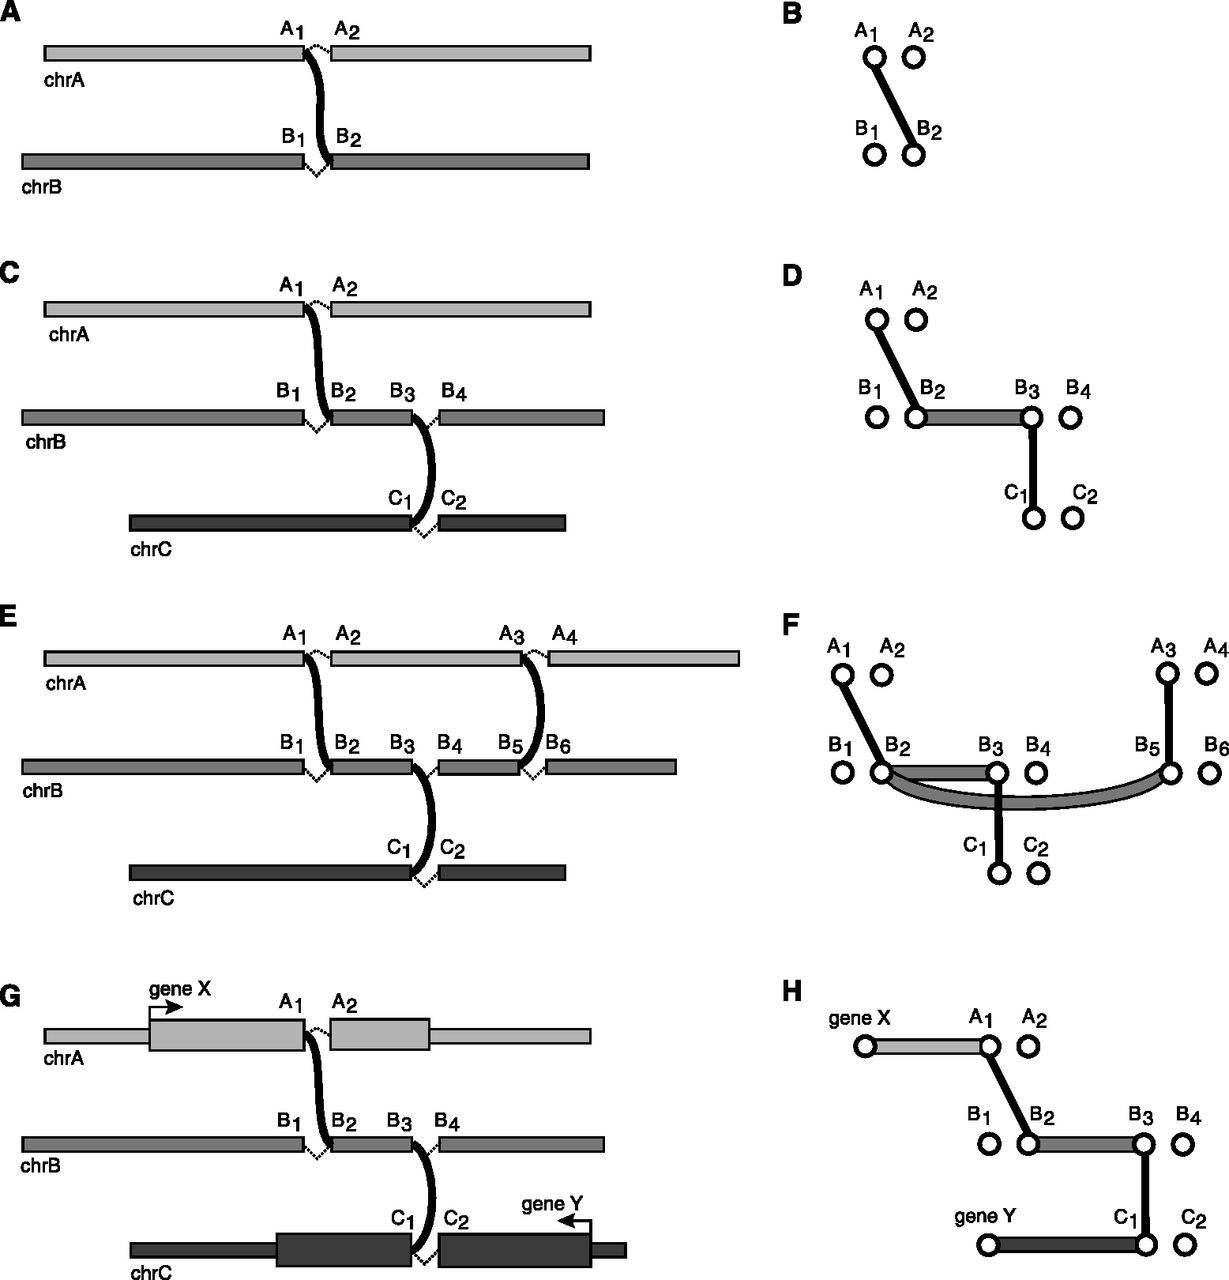
Figure 1.
Breakpoint graphs and polyfusions. (A) A breakpoint as an unexpected adjacency. (B) The breakpoint graph for a single breakpoint showing a breakpoint edge. (C) Two breakpoints on chromosomes A, B, and C. (D) The breakpoint graph for the two breakpoints showing two breakpoint edges and an adjacency edge. (E) Three breakpoints on chromosomes A, B, and C. (F) The breakpoint graph for the three breakpoints showing a (B2, B5) adjacency edge that encodes the optional nature of breakpoint (B3, C1). (G) Breakpoints for an X-Y gene fusion with a complex breakpoint. (H) The breakpoint graph for the complex breakpoint showing an alternating path between X and Y.


