
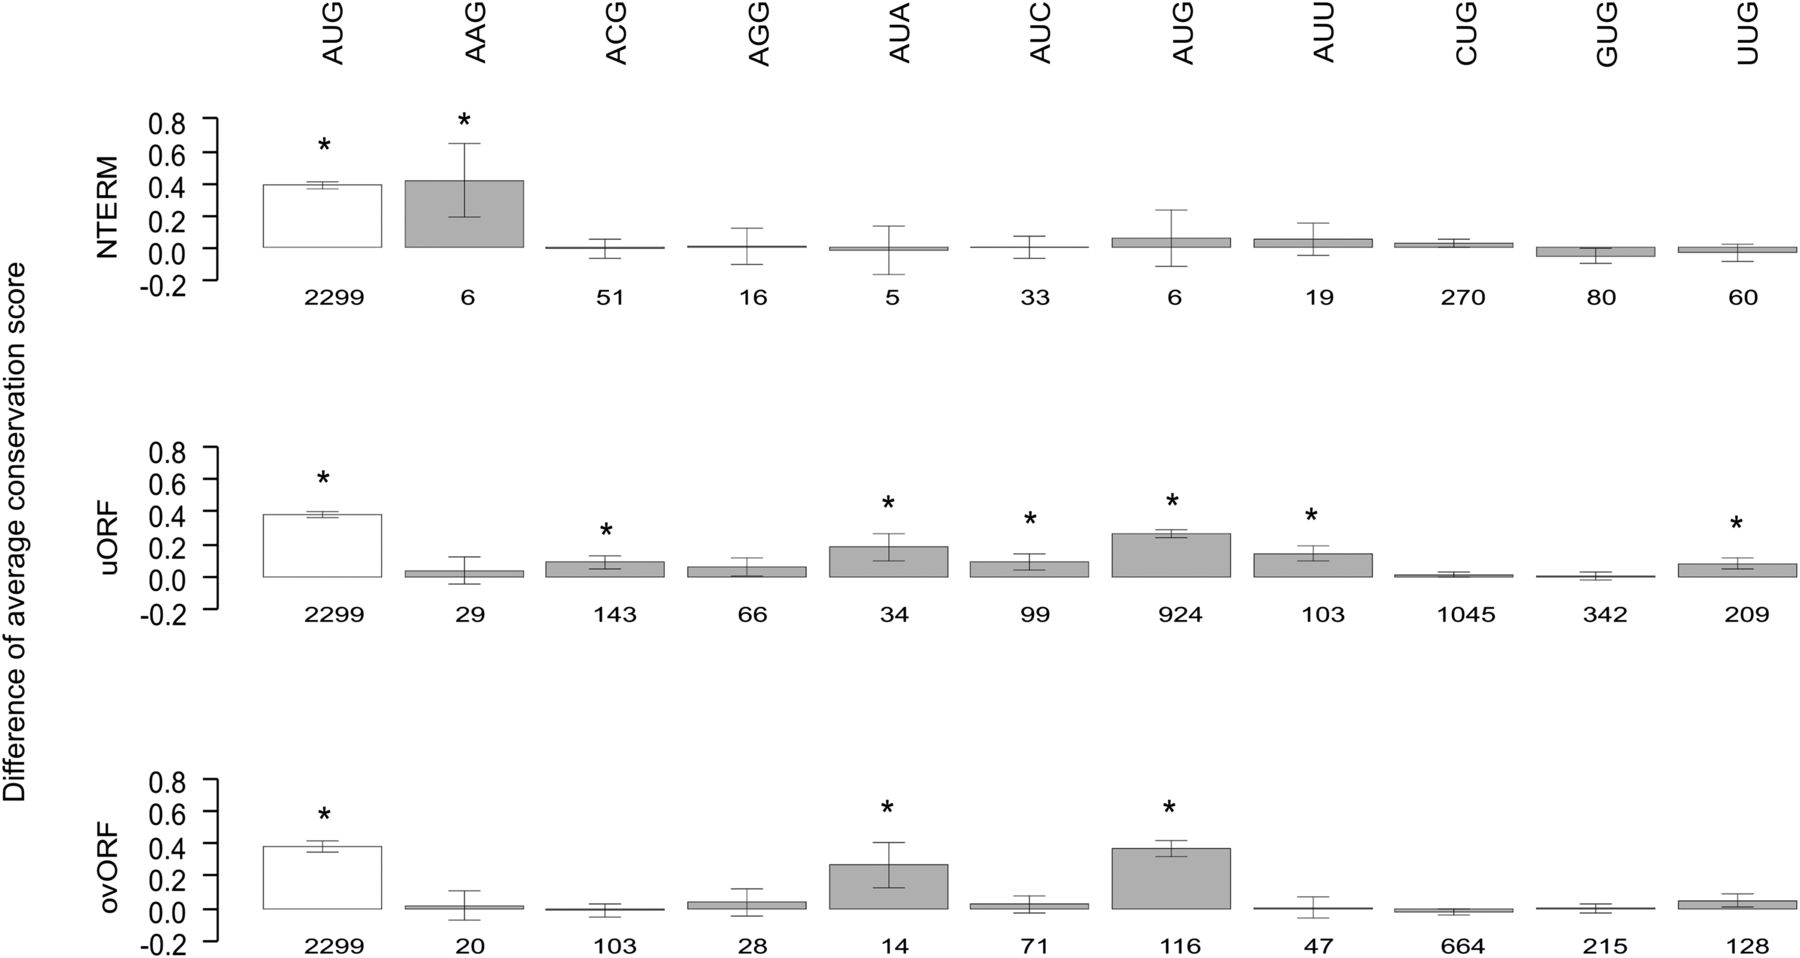
Primate conservation analysis of TICs at neural network-predicted TISs. For each functional category and codon type, the difference in mean Conservation Score in nine primate species (with 95% confidence interval) is depicted between case and control TICs. For comparison, the difference in mean Conservation Score for the annotated AUG TICs (open box) is also included for each category. Numbers below boxes refer to the number of predicted TIS falling into the respective TIS by TIC category. TICs showing statistically significant conservation after Bonferoni correction (31 tests, P < 0.0016) are marked by an asterisk. Further details of the primate conservation analysis are provided in Supplemental Table 3.


