
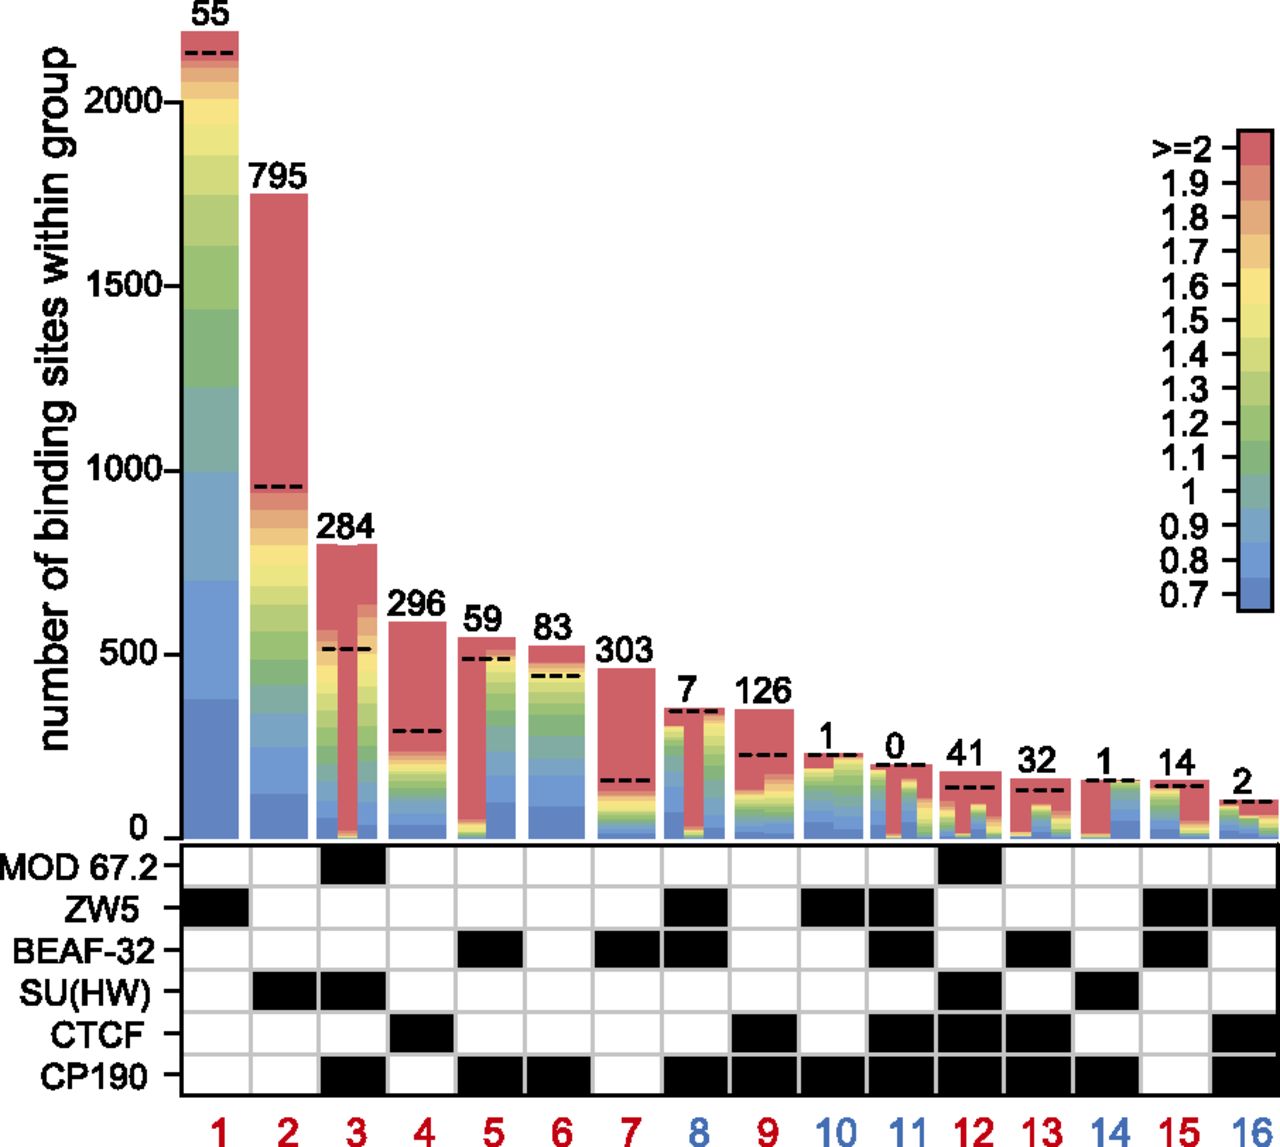
The classes of insulator protein binding sites. The composition of 16 co-binding groups detected by initial overlap comparison is indicated by the checkerboard pattern under the bar plot. The color code in log2(IP/INPUT) units (indicated to the right) is used to show the number of sites of different binding strength within each class. For the multiprotein classes, the bars are divided from left to right corresponding to the top to bottom positions of the proteins in the chart below. The numbers of sites of each class that bind all corresponding proteins within 60% of their ChIP-chip signal dynamic range are indicated above the bars. Only those sites were used for further analysis. The dashed line on each bar indicates the position of the 60% cutoff. The classes representing robust co-binding combinations are numbered in red.


