
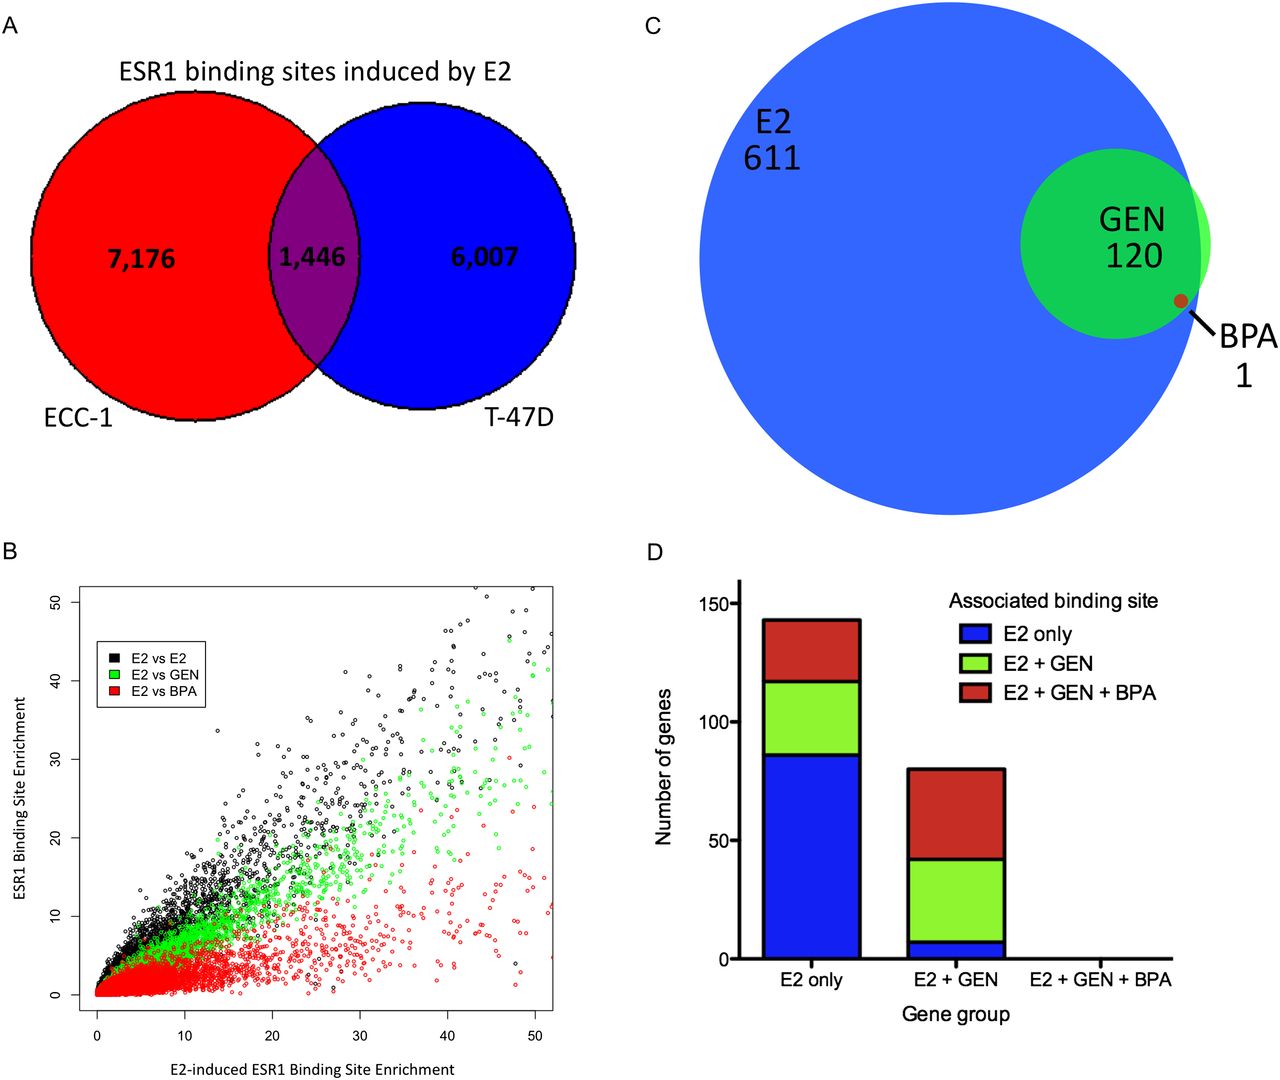
Figure 6.
GEN and BPA induce ESR1 binding and expression changes in T-47D. (A) The overlap between E2-induced ESR1 binding sites in ECC-1 and T-47D is displayed. (B) Binding site signal strength is plotted for each binding site with E2-induced signal strength (replicate 1) on the x-axis vs. E2 (black; replicate 2), GEN (green; replicate 1), and BPA (red; replicate 1) signal strength on the y-axis for T-47D. (C) The overlap between genes regulated by E2, GEN, or BPA is shown as a Venn diagram. (D) The number of genes in each group that are within 50 kb of ESR1 binding sites (also broken out by group) is shown for up-regulated genes.


