
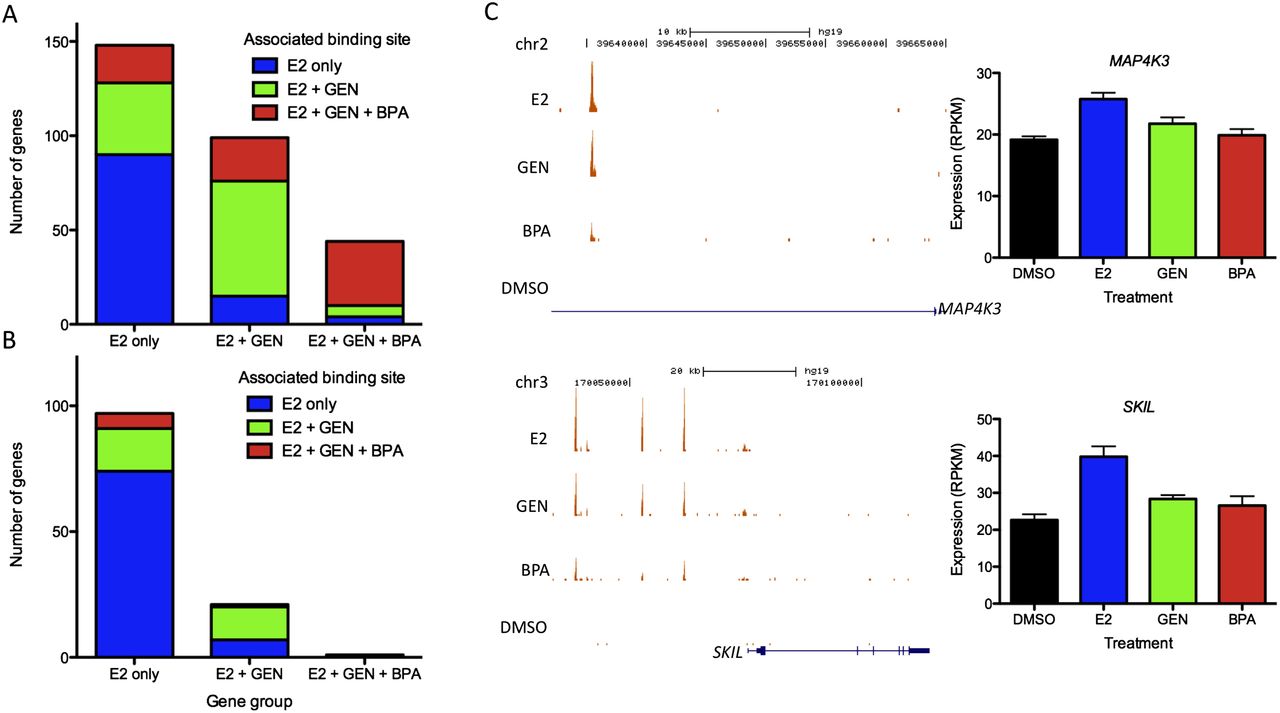
Figure 4.
Association between ESR1 binding and gene expression changes in response to E2, GEN, and BPA. The number of genes in each group that are within 50 kb of ESR1 binding sites (also broken out by group) for up-regulated (A) and down-regulated (B) genes. (C) ChIP-seq signal and gene expression levels after E2-, GEN-, BPA-, and DMSO-treatment are shown for two representative genes. The height of the orange graph represents the normalized number of reads for each ChIP-seq experiment. Error bars represent s.e.m.


