
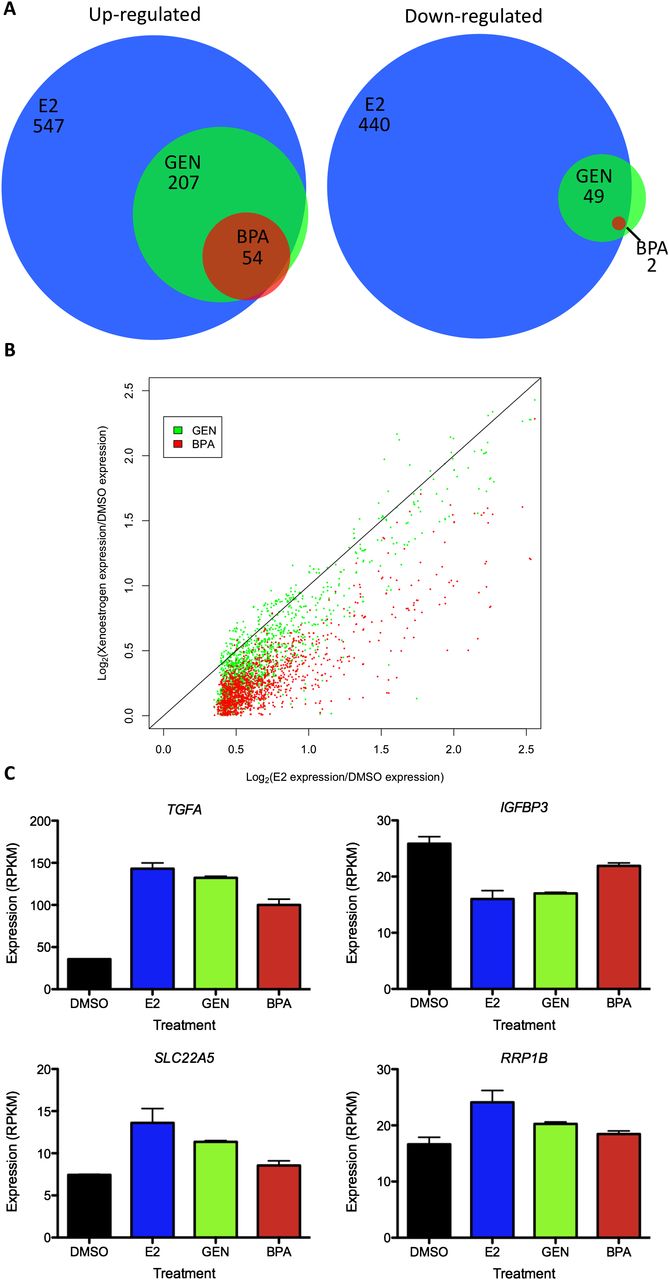
Figure 3.
Gene expression changes in response to GEN and BPA. (A) The overlap between genes up-regulated (left panel) and genes down-regulated (right panel) by E2, GEN, and BPA. (B) A scatter plot shows the relative magnitude of gene expression changes with log2 of the fold change induced by E2 on the x-axis, and log2 of the fold change induced by GEN (green) and BPA (red) on the y-axis. The black line represents equal magnitude. (C) Examples of gene expression measurements in DMSO, E2, GEN, and BPA are shown for four representative genes. Error bars represent s.e.m.


