
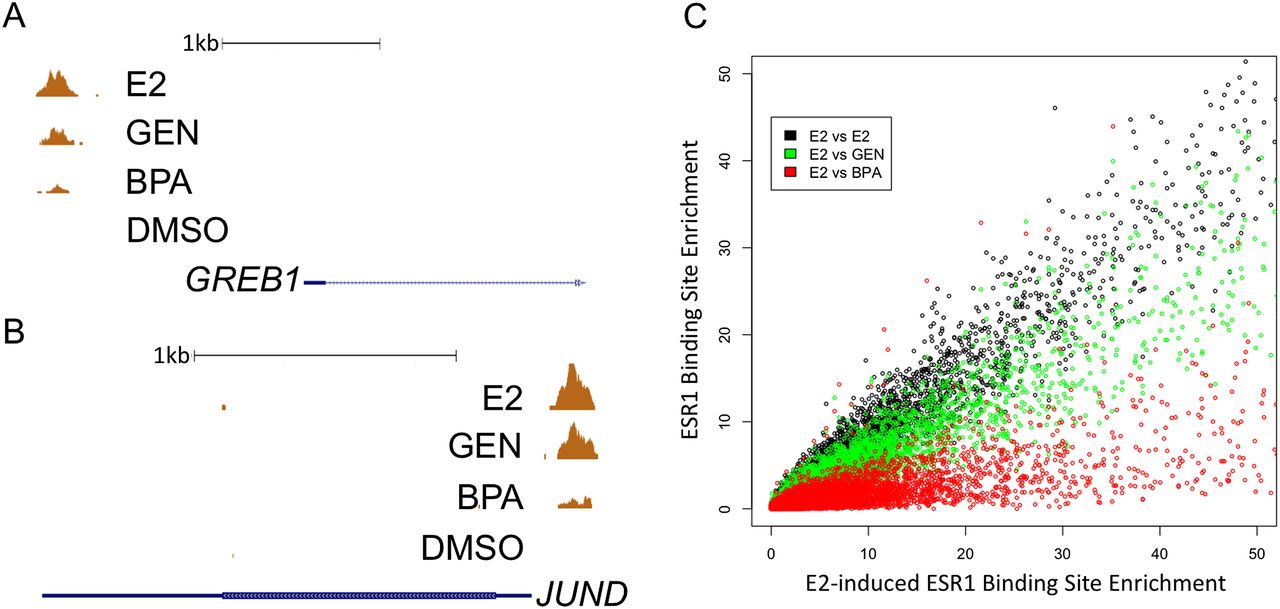
Figure 1.
ESR1 binding is induced by GEN and BPA. Examples of ESR1 binding induced by E2, GEN, BPA, and DMSO near the promoters of GREB1 (A) and JUND (B) in ECC-1 are shown. The height of the orange graph represents number of reads per 1 million total reads. (C) Binding site signal strength is plotted for each binding site with E2-induced signal strength (replicate 1) on the x-axis vs. E2 (black; replicate 2), GEN (green; replicate 1), and BPA (red; replicate 1) signal strength on the y-axis for ECC-1.


