
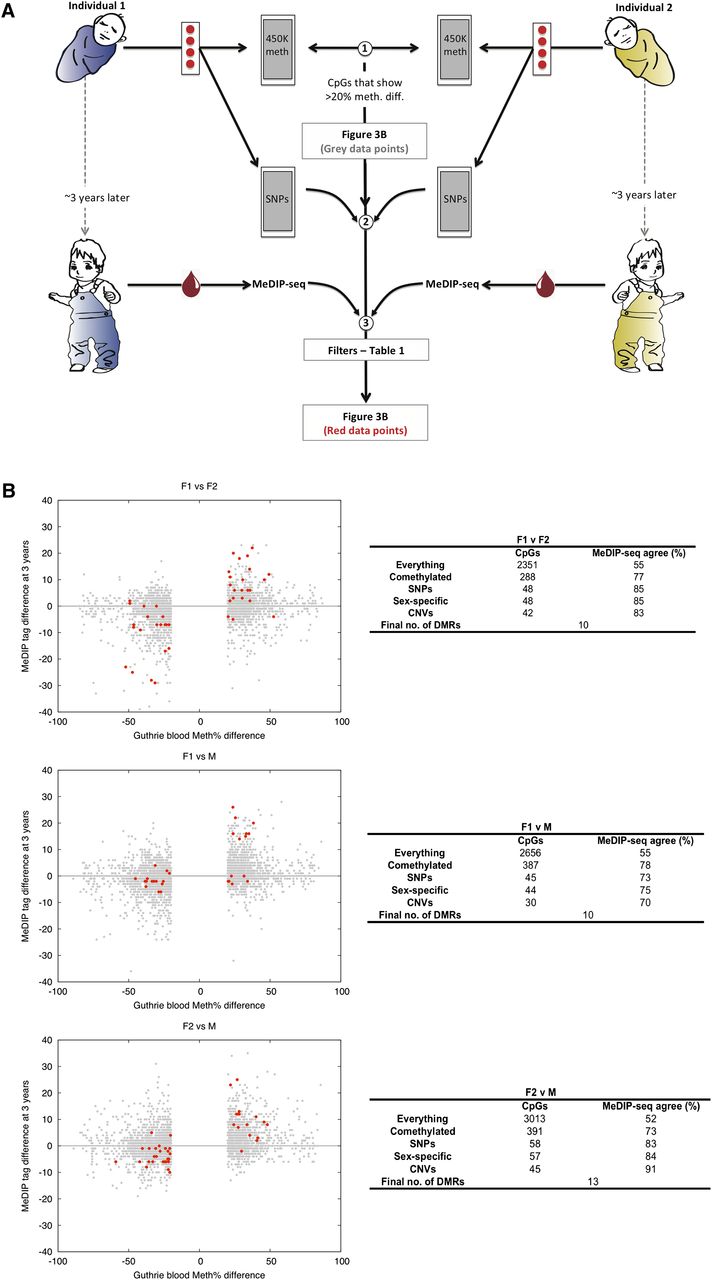
Identification at birth of temporally stable individual-specific DNA methylation variants. (A) Experimental strategy schematic: (1) Guthrie card Illumina450K profiles were generated and >20% interindividual pairwise methylation differences called (sex chromosome data were excluded from all analyses); (2) SNP data were also generated from Guthrie card DNA; (3) a variety of filters (detailed in Table 1) were applied to the Illumina450K profiles, and then validation was performed using MeDIP-seq profiles of blood sampled when the individuals were 3 yr old. (B) Identification of temporally stable interindividual DMRs that exist at birth. (Gray points) Single CpG interindividual differences of >20%; (red points) the filtered set. The number of CpGs remaining after each filter is indicated in the adjoining tables. The final sets of CpGs (red points in the figure) were grouped into “DMRs”—differentially methylated regions. Binomial P-values (calculated at a per-DMR level) for the “Agreement scores” between Illumina450K and MeDIP-seq data are: F1 vs. F2: P = 0.01, F1 vs. M: P = 0.11, F2 vs. M: P = 0.0003.


