
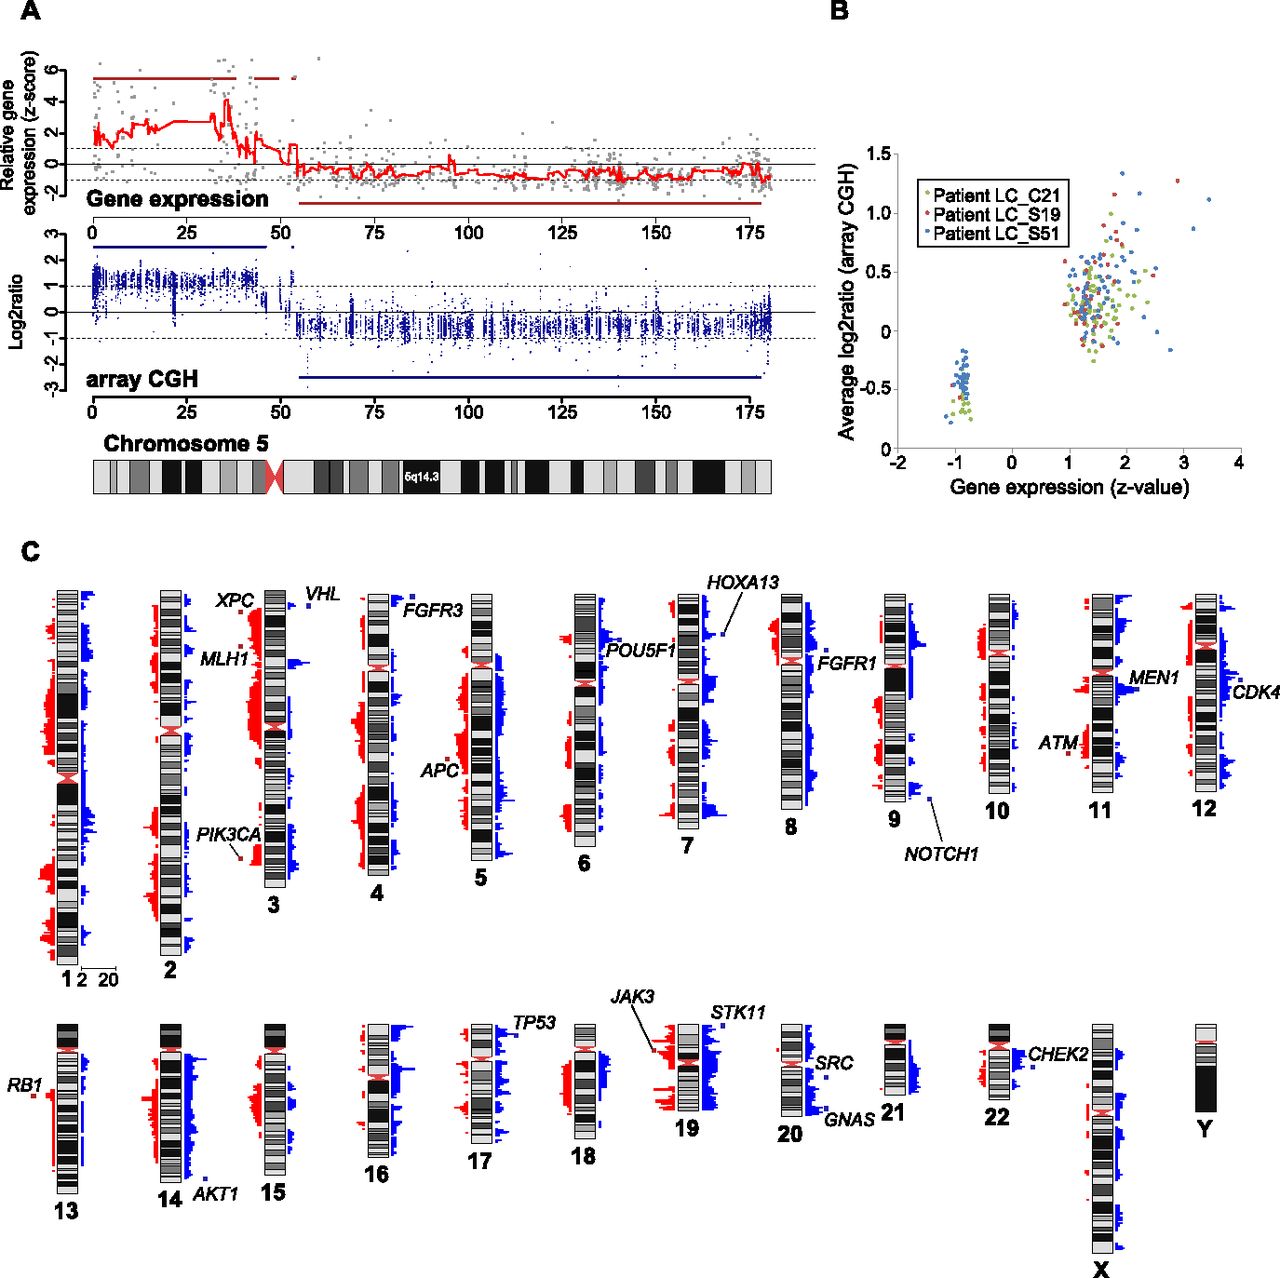
JRBs identified from gene expression signatures. (A) Large JRBs observed on chromosome 5 in one cancer sample (patient LC_S51) and its high correlation with CGH array results. (Top row) Relative expression levels of the genes on chromosome 5 (gray dots), their moving averages (red line), and detected JRBs (red horizontal bars). (Middle row) CGH array results for patient LC_S51. Log2 ratio of probes (blue dots) and identified copy number alterations (blue horizontal bars). (Bottom row) Karyogram of chromosome 5. (B) Correlation between JRBs and CGH array data for three cancer specimens. The x-axis represents the averaged Z-scores of JRB and the y-axis indicates the averaged CGH array log2 ratios for the genomic area. (C) The genomic location of JRBs and number of cancer tissues involved. Increased- and decreased-expression JRBs are shown in blue and red bars, respectively.


