
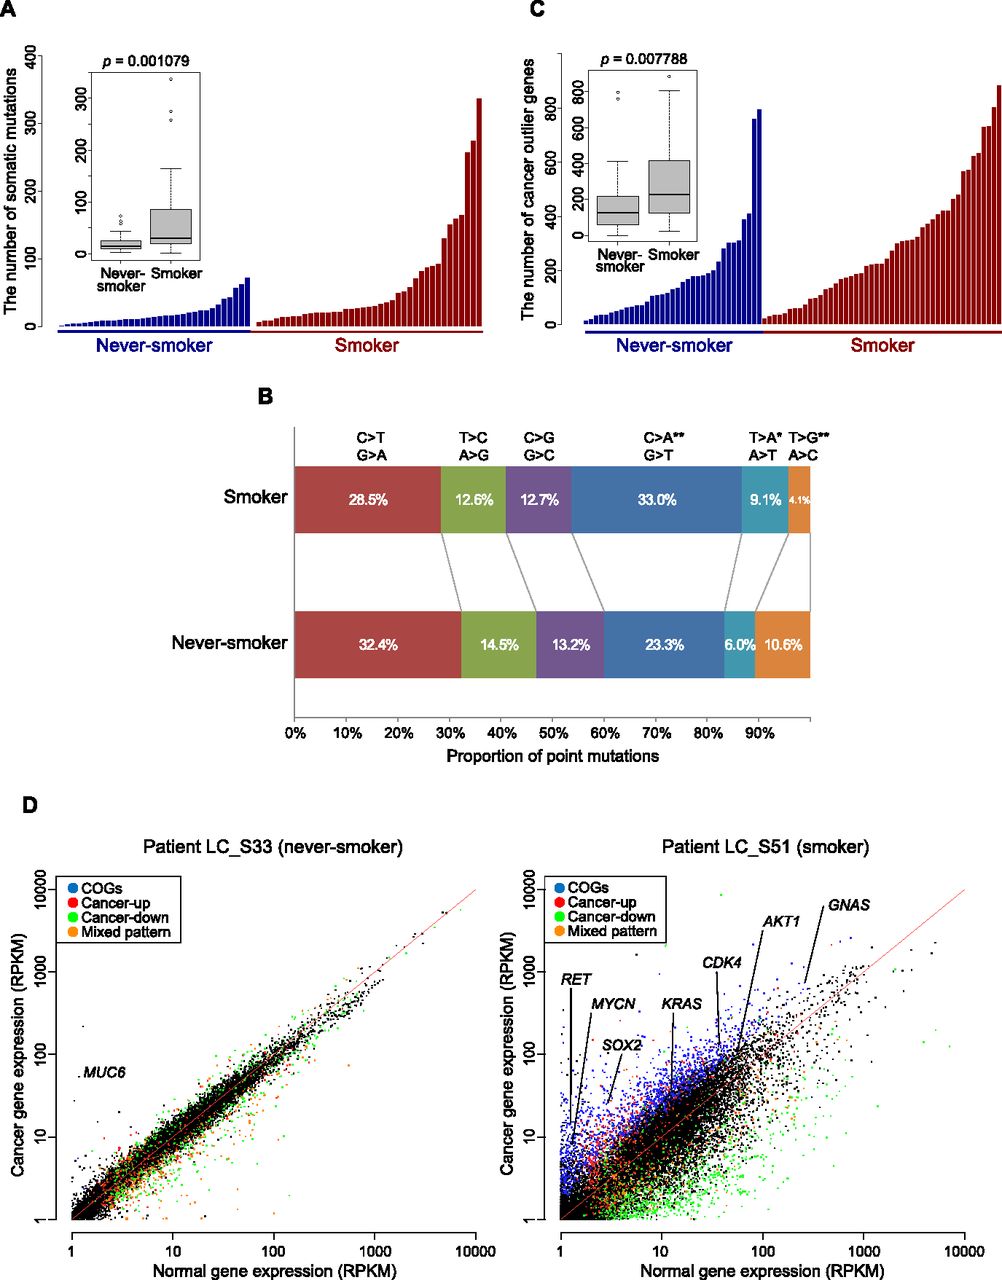
Mutational and transcriptional variation in cancer between never-smokers and smokers. (A) The number of somatic mutations (nonsynonymous single nucleotide and short-indel mutations) in the cancer tissue of each patient. Patients are classified into never-smokers and smokers, and further sorted by mutation count. (Inset) Box plot of somatic mutation counts for never-smokers and smokers. The two groups are significantly different (P = 0.001079). (B) The proportion of the six possible nonsynonymous substitutions found within smokers and never-smokers. The two groups were significantly different with respect to transversions C > A and T > G (**, P < 0.001) and transversion T > A (*, P < 0.01). (C) The number of cancer-outlier genes (COGs; extremely high-expressed genes in a subset of cancer specimens; see Methods for details) in each cancer tissue. Patients are sorted as above. (Inset) Box plot showing that lung adenocarcinoma in smokers contains more cancer-outlier genes. (D) Gene expression within cancer tissues against average expression in normal tissue. Scatter plots for patients LC_S33 (a never-smoker patient) and LC_S51 (a smoker patient) are shown, providing an example of the variation in gene expression perturbation. Selected genes of interest are labeled. Genes were categorized as “Cancer-up” where generally overexpressed and “Cancer-down” where generally underexpressed in lung cancer compared with paired-normal tissue by hierarchical clustering (see Supplemental Material).


