
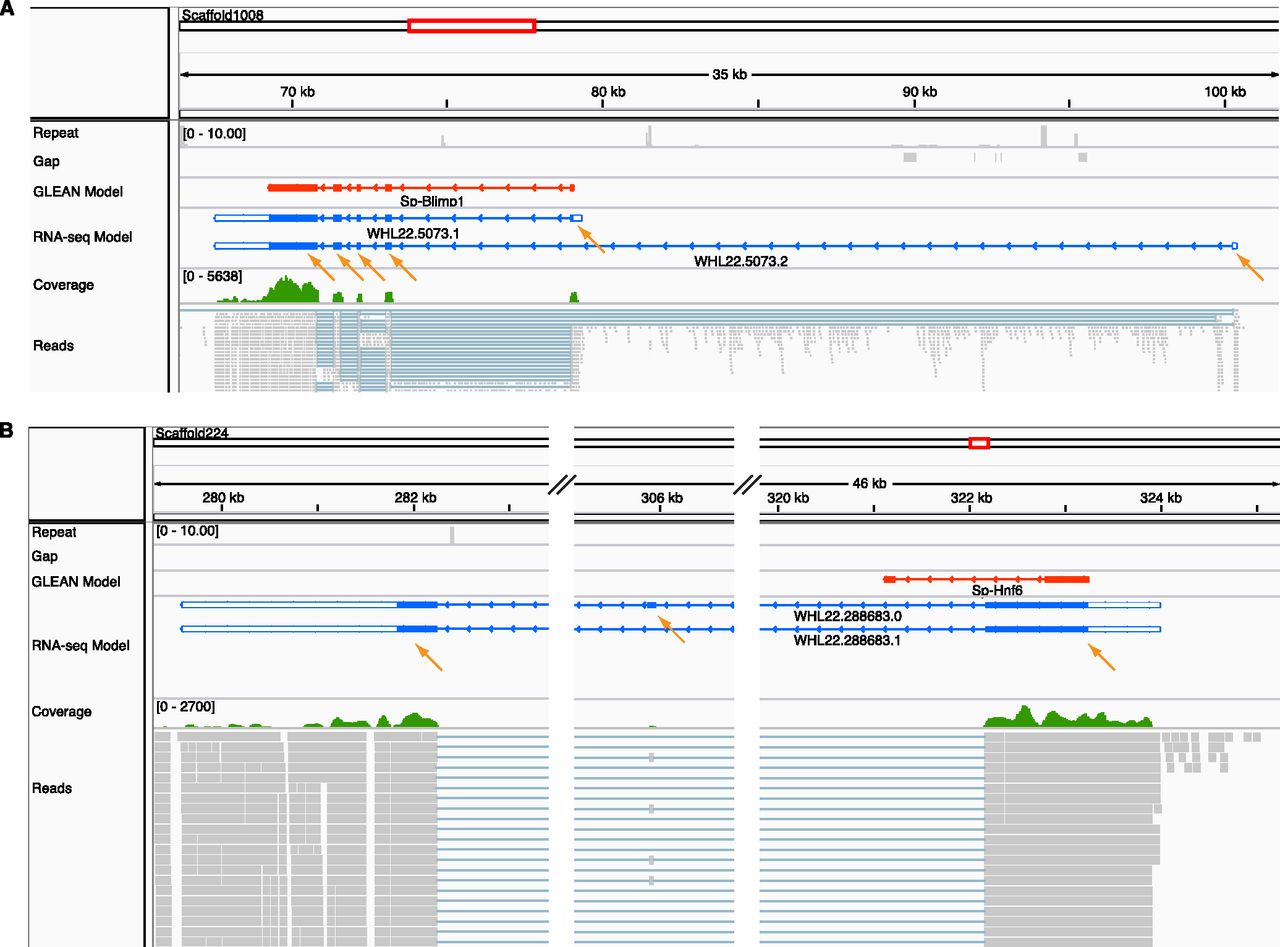
Discrepant predicted and observed gene structure displayed in the IGV genome browser. A selectable variety of aligned features is shown in horizontal tracks with the feature label to the left: Repeat sequences (gray; shows the number of matches using 76-bp sequence windows in the whole genome, using Bowtie with the same parameters as when mapping the reads); Gap (gray; sequence regions of the genome assembly that lie in gaps and are therefore undetermined; several short gaps are shown in A); GLEAN model (red; the original gene model predicted by the GLEAN method); RNA-seq gene models (blue; the models produced by this study; the blank terminal regions are UTRs); Coverage (green; a graphical presentation of the number of sequencing reads that align at a particular location); Reads (gray; the alignment of individual reads to the genome sequence). (Orange arrows) Individual RNA sequence-derived exons. (A) The genomic structure of the gene blimp1. The overall structure of the GLEAN gene model is correct except longer UTRs are recovered and an alternatively spliced isoform that uses a distant 5′ exon is recovered. (B) The genomic structure of the gene hnf6. The GLEAN model predicted an incorrect exon1/intron1 boundary, and the 3′ exon is not supported by sequence. The correct 3′ exons and two isoforms were identified from the RNA sequence data.


