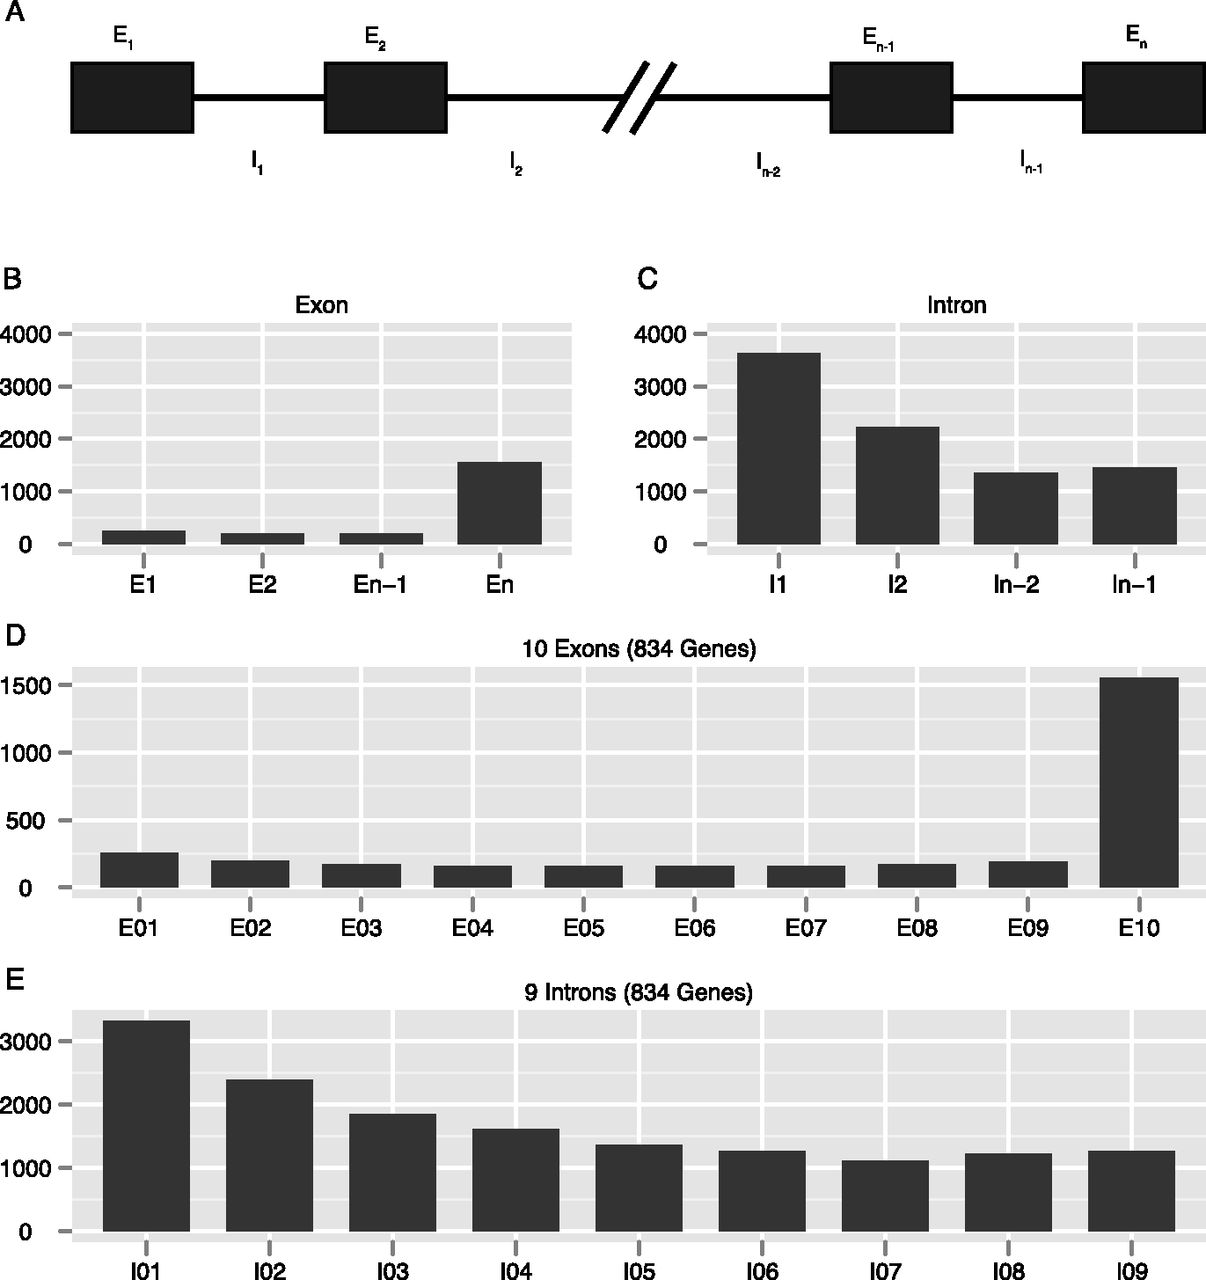
Gene structure in the sea urchin Strongylocentrotus purpuratus based on transcriptome analysis

(Downloading may take up to 30 seconds. If the slide opens in your browser, select File -> Save As to save it.)

Click on image to view larger version.

Figure 3.
Figure 3.

Lengths of exons and introns with respect to their relative positions in genes. (A) Labeling method for introns and exons used in the following panels. (B,C) Average length of exons and introns diagrammed in A. (D,E) Average length of each exon and intron in all genes containing 10 exons.

This Article

  1. Genome Res. 22: 2079-2087

Preprint Server