
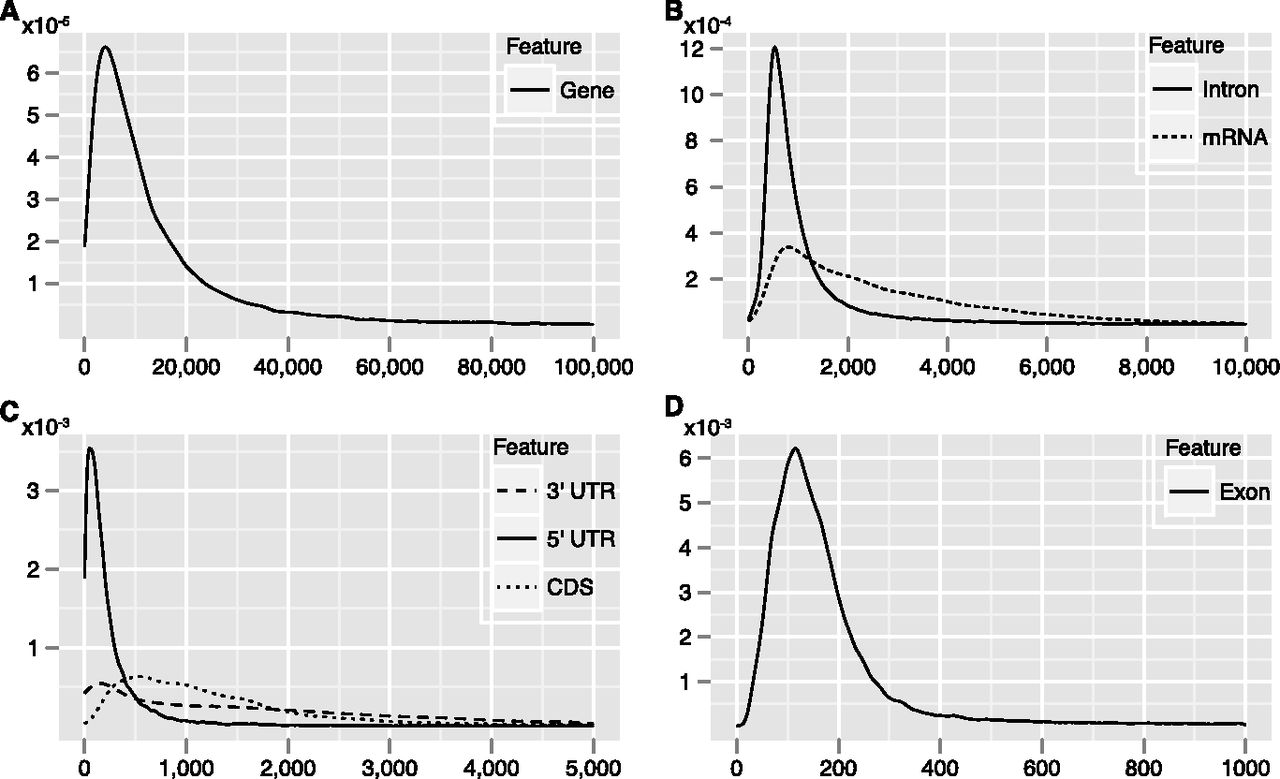
Figure 2.
Length distributions of protein-coding genes and their components. Essentially these plots are smoothed versions of a histogram where the ordinate represents the frequency of the given length in base pairs. All distributions have very long tails, and the plots only show part of the distributions: (A) genes, 0–100 kb; (B) introns and mRNA, 0–10 kb; (C) UTRs and CDS, 0–5 kb; (D) exons, 0–1 kb.


