
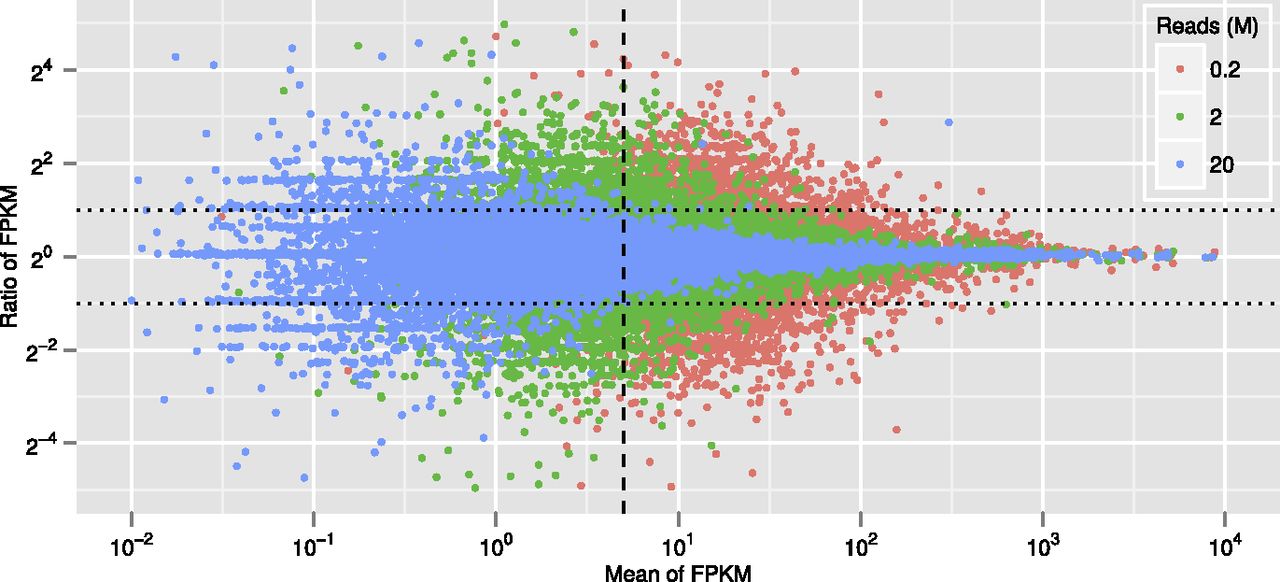
Figure 1.
Computational simulation of quantitative variations at different sequencing depths. The ordinate, ratio of FPKM per transcript species in the two data sets compared, is given in log2; the abscissa, mean of the two FPKM values, in log10. (Blue dots) 20 million (M) reads; (green dots) 2M reads; (red dots) 0.2M read. (Vertical dashed line) Average FPKM 5; (horizontal dotted lines) ± twofold change. The plot shows that in the 20M read data set, prevalence estimations for almost all mRNAs over FPKM 5 are within twofold.


