
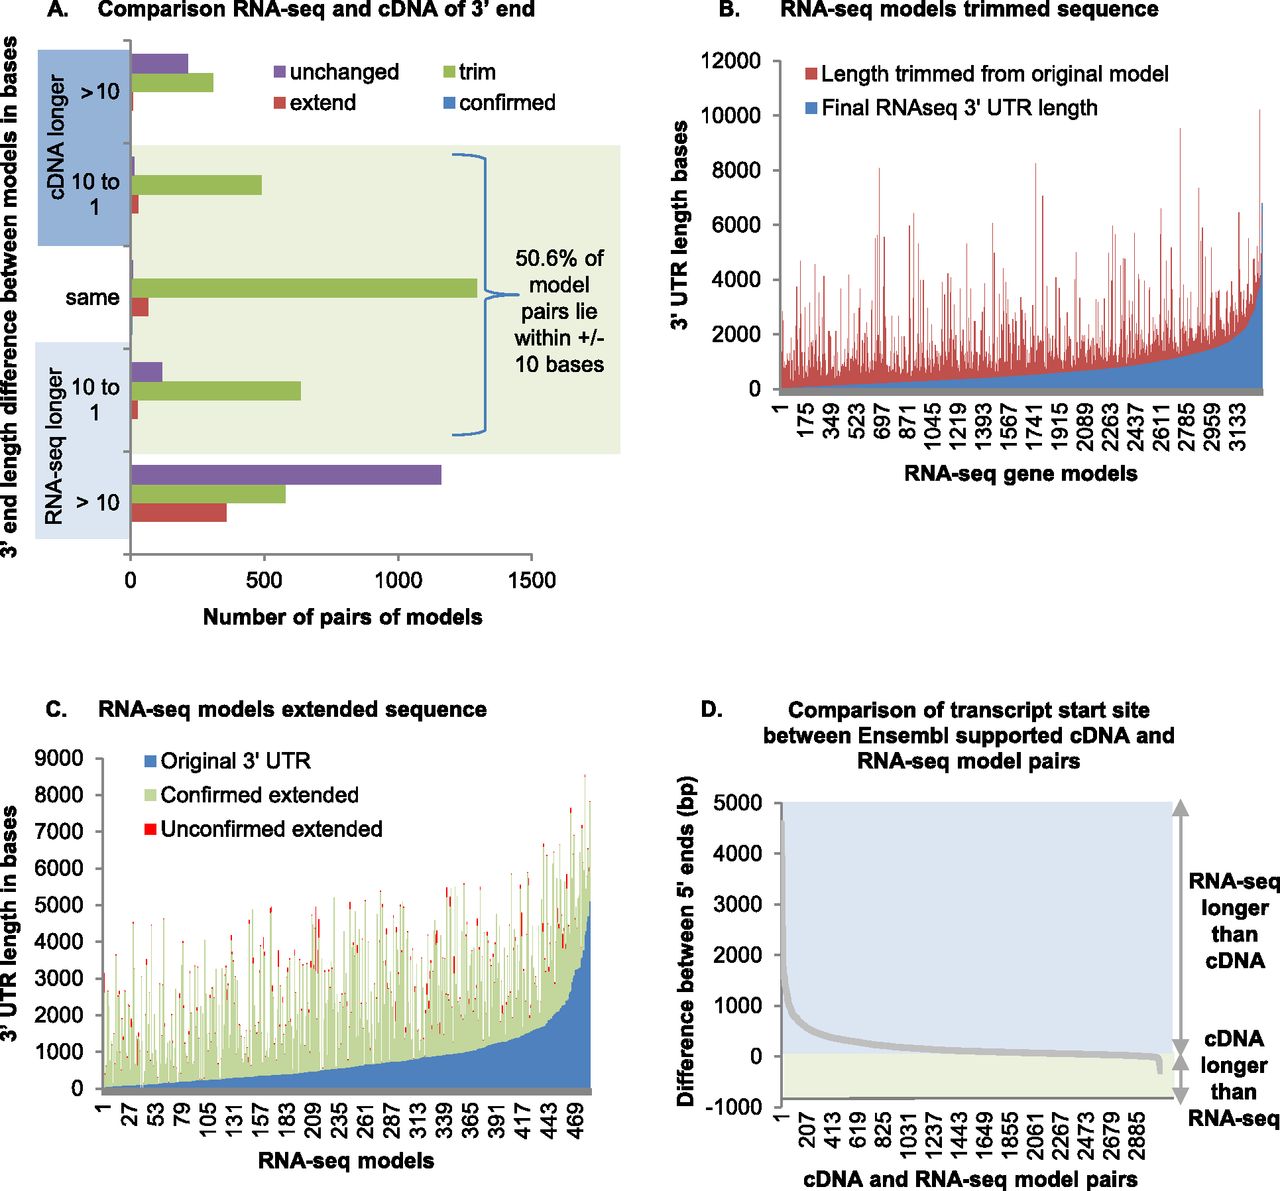
Gene model end prediction. (A) The 3′ end of RNA-seq models from the original genebuild were compared with 3p marker data and scored as trimmed, extended, confirmed (if identical), or left unchanged. The 3p altered RNA-seq models were matched to their cDNA-supported Ensembl model pair, and 5311 passed a series of filters, including pairs where the best match whole transcript coincided with the best match coding region, both ORFs stopped at the same genomic coordinate, and there were no introns in either of the 3′ UTR regions, thus excluding fused gene models. The 3′ UTR length was compared; in 1063 cases the cDNA model was found to be longer, in 2875 cases the RNA-seq model was longer, and in 1373 cases they were exactly the same. The length of the 3′ UTR of model pairs was compared, the difference in length calculated, and shown on the y-axis. Model pairs where the RNA-seq transcript is longer are in the bottom light-blue section, the pairs where the cDNA-supported Ensembl transcript is longer are in the top dark-blue section, and the pairs with identical length are in the middle. The model pairs with the specified length difference are shown for all four possible 3p marker alterations (trimmed in green, extended in red, confirmed in blue, and unchanged in purple). The length of the bar indicates the number of model pairs with the indicated length difference after the 3p marker alteration performed. (B) The 3289 trimmed RNA-seq-only models filtered as above are shown. The blue bars show the 3′ UTR length after trimming, the red bars show the length trimmed, and the blue plus red bars show the original 3′ UTR length. (C) Filtered RNA-seq models extended by 3p marker data are shown. The blue bars show the 3′ UTR length after the original RNA-seq genebuild before extension, while the green plus red bars show the length of extension. The green bars show the total number of bases covered by RNA-seq reads and the red bars the total number of bases not covered, these are not necessarily consecutive. For clarity, only the models with 10 or more bases not confirmed by RNA-seq sequence are shown. Note that the RNA-seq libraries are not directional, so it is possible that the reads used for this confirmation are on the opposite strand. (D) The 3078 cDNA-supported Ensembl transcripts that share a start codon within the first exon with an RNA-seq-only model were compared. The y-axis shows the difference in length between model pairs, with the green regions indicating where the cDNA-supported Ensembl transcript is longer and the blue region indicating where the RNA-seq-only model is longer.


