
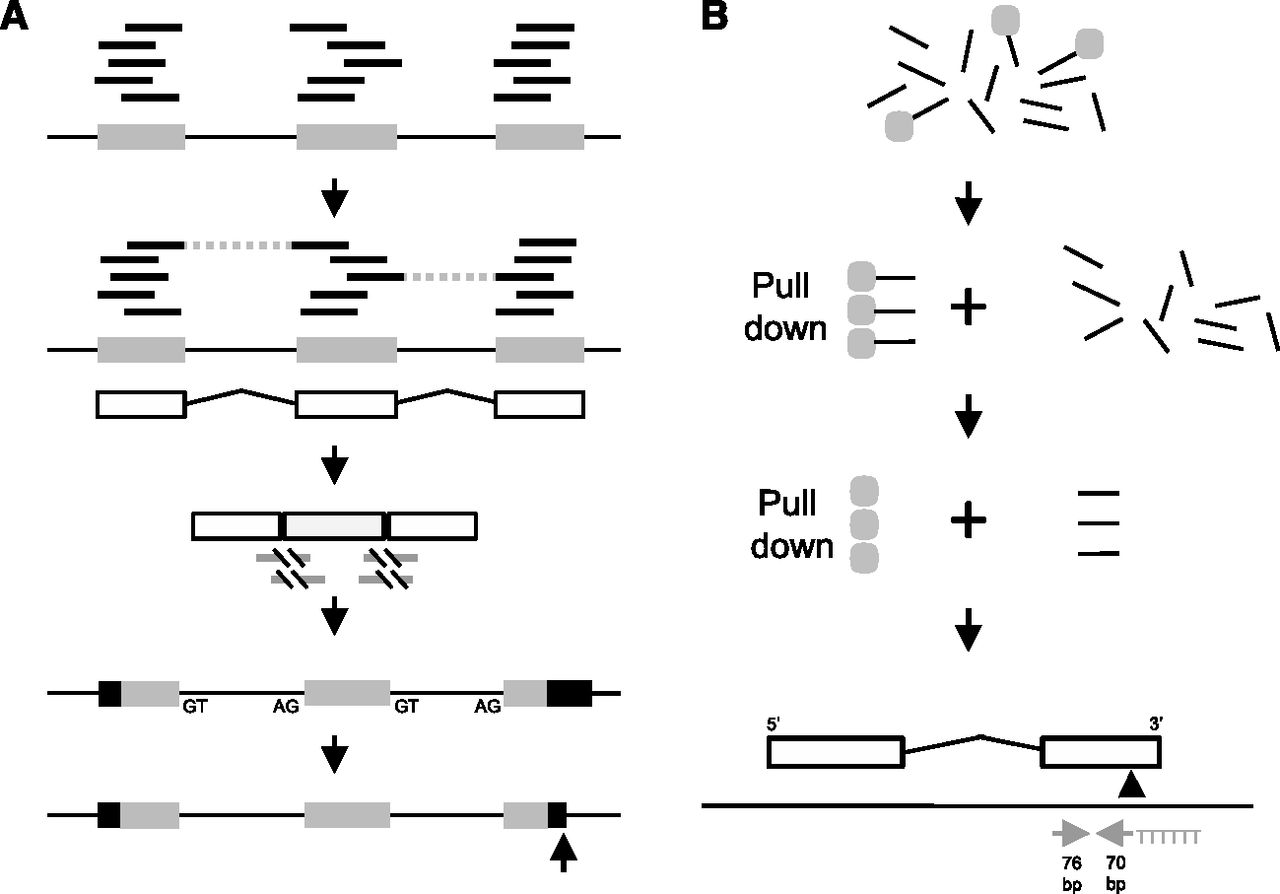
RNA-seq only gene models and 3′-end pull-down pipelines. (A) Illumina reads (short black lines) were matched to repeat-masked genomic reference sequence (long black line) using exonerate, and clusters were called as potential exons (gray boxes). Read pair information was used to identify adjacent exons belonging to the same gene (dashed lines). A rough gene model was built (white boxes are exons and angled black lines are introns). A total of 20 bases of genomic sequence were added to each side of the exons, and exons within a rough model were concatenated. Illumina reads were mapped again to the concatenated rough models using exonerate est2genome probabilistic splice model (gray lines are the aligned portion and the black slash lines show the breaks across the intron, identifying intron spanning reads). Exons were trimmed or extended to the identified splice sites and located back on the genome reference. The splice sites were used to identify the correct strand, and the longest open reading frame was predicted in each refined gene model (black are untranslated regions and gray boxes are coding). 3p markers were located at the 3′ end of the gene (black arrow) and the models were extended or trimmed as necessary. (B) Total RNA was chemically fragmented (short black lines), a 5′ biotinylated polyT22 anchored primer containing a BpmI site (underlined) (GGCCAGTCCTGGAGTTTTTTTTTTTTTTTTTTTTTTVN) was annealed and bound to a streptavidin magnetic bead (gray circle). The polyA RNA fragments were pulled down with a magnet, the rest of the RNA was thrown away and double-stranded cDNA was synthesized. The cDNA was released from the beads by restriction digest with BpmI, which cuts 16 bases upstream of the recognition site, leaving 6 T bases at the 5′ end of the fragment. Standard Illumina libraries were made, followed by paired end sequencing of 76 bases each. Fragments with a 3′ polyA (5′ polyT) resulted in two reads where one read began with T bases derived from the polyA pull-down oligo. If there were at least five T bases, all of the T bases were removed; this was normally six T bases to produce 70/76 base pair of reads. These were mapped to the genomic reference sequence (gray arrows) with the 5′ end of the 70-base read indicating a possible polyA addition site as well as the orientation of the transcript. These were filtered for duplicate read pairs, the proximity of a BpmI site in the genome sequence, polyA or degenerate polyA adjacent to the proposed 3′ end, the orientation of the proposed 3′ end compared with the gene model and for model extension the presence of overlapping genes on the other strand. The original RNA-seq models were not extended more than 5001 bases. If more than three reads satisfied all of the filters, the genomic coordinate of the 3p marker was predicted (black arrow).


