
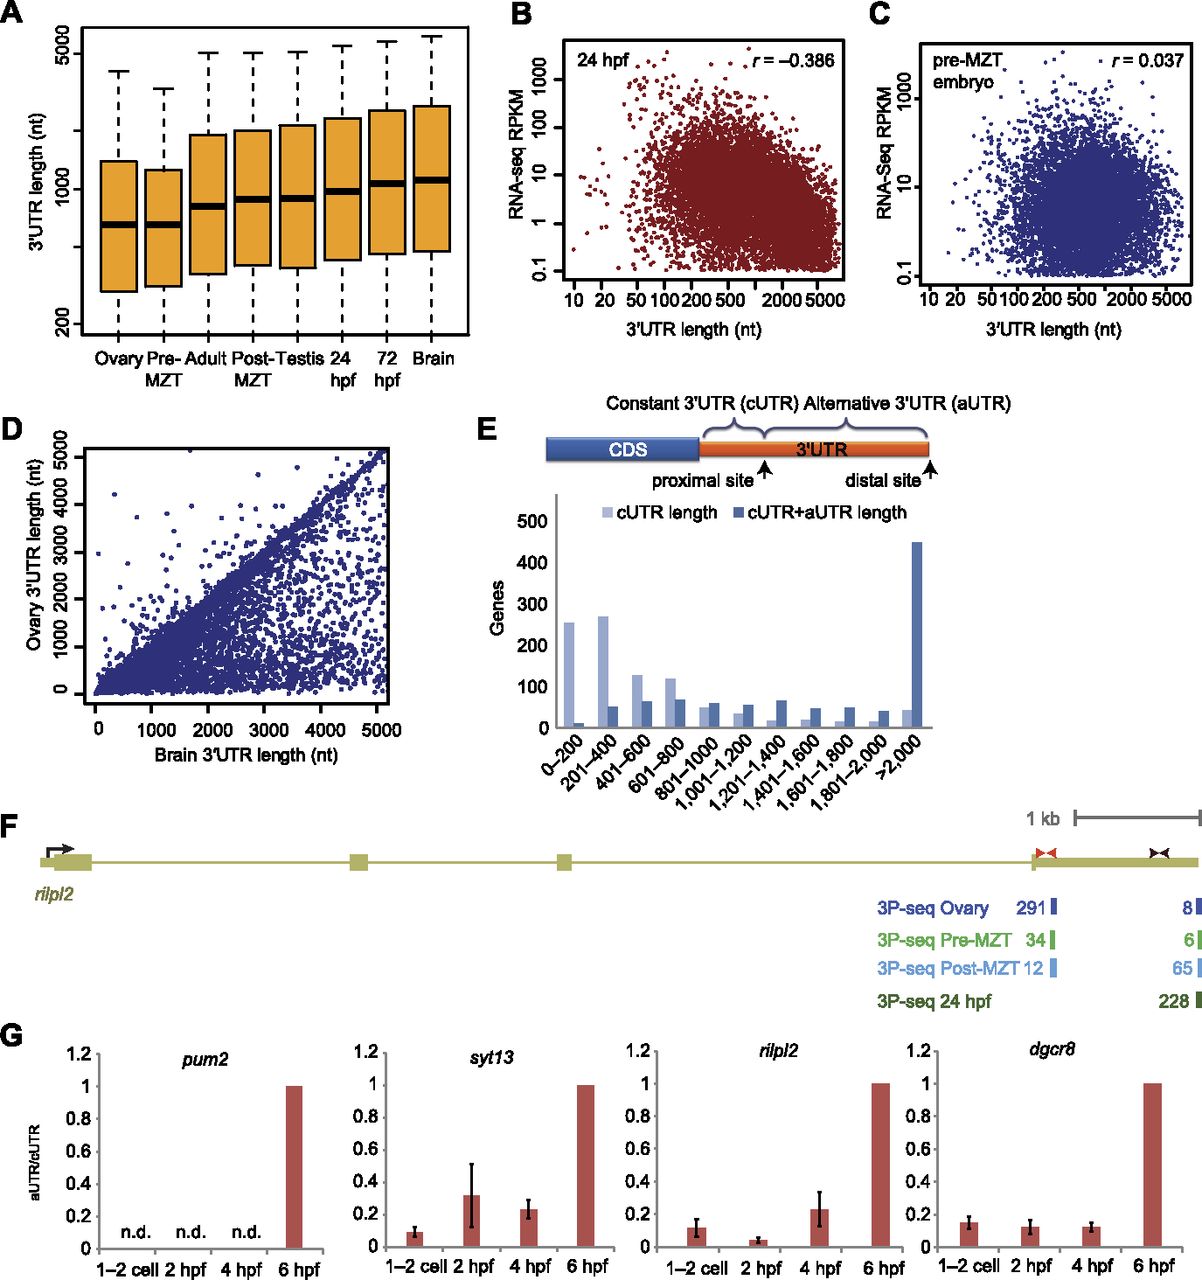
Changes in 3′ UTR lengths in different developmental stages. (A) Distribution of 3′ UTR lengths in different stages and tissues. In each sample, for each gene with a single annotated or predicted stop codon and 3P-seq data, the mean 3′ UTR length was computed by averaging the lengths of all the 3′ UTRs, weighted by the number of 3P tags supporting each of them. Box plots show the median length, flanked by 25th and 75th percentiles. The whiskers are drawn to the fifth and 95th percentile. (B) Negative correlation between 3′ UTR length and transcript levels 24 hpf. For each gene, the mean 3′ UTR length was computed as in A, and the RPKM was computed using available RNA-seq data from the same developmental stage (SRA accession ERP000016), considering only protein-coding regions. (C) Lack of correlation between 3′ UTR length and transcript levels in the pre-MZT embryo. As in B, except RNA-seq RPKM was computed using available RNA-seq data from the two-cell embryo (SRA accession ERX008924). (D) 3′ UTR lengths of genes expressed in the ovary and in the brain. Lengths were computed as in A. (E) Lengths of 3′ UTRs resulting from proximal and distal poly(A) sites in analysis of genes with substantial differences in isoform fractions (>0.3) when comparing ovary and brain samples. (F) Poly(A) sites of rilpl2. The gene model shown is as annotated in Ensembl v66. 3P-seq tracks show tags from clusters containing at least 10% of the tags in the indicated samples. (Red and black arrows) Position of the qRT-PCR primers for the constant and the alternative regions of the transcript, respectively. (G) qRT-PCR analysis of changes in 3′ UTR usage during early embryogenesis. RT was performed with random primers and expression levels were computed using probes located in the constant and alternative regions of the transcript (cUTR and aUTR, respectively) (Supplemental Fig. S4) and normalized to expression at 6 hpf. (n.d.) aUTR could not be detected at that time point.


