
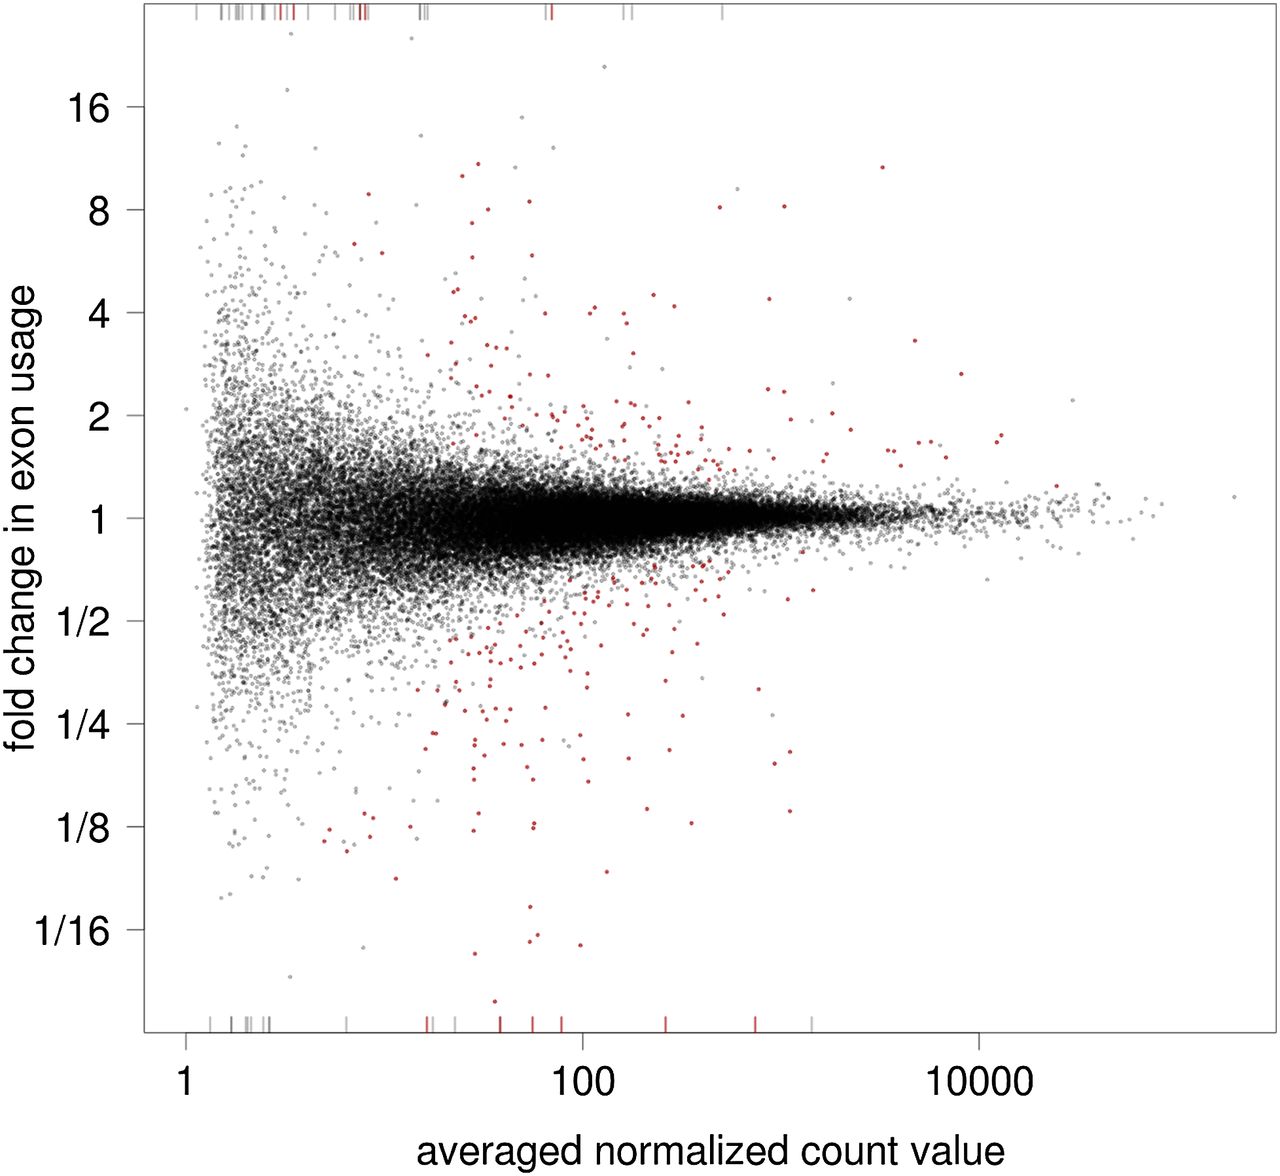
Figure 4.
Fold changes of exon usage versus averaged normalized count value for all tested counting bins for the Brooks and coworkers data. (Red) Significance at 10% FDR. Bars at the margin represent bins with fold changes outside the plotting range.


