
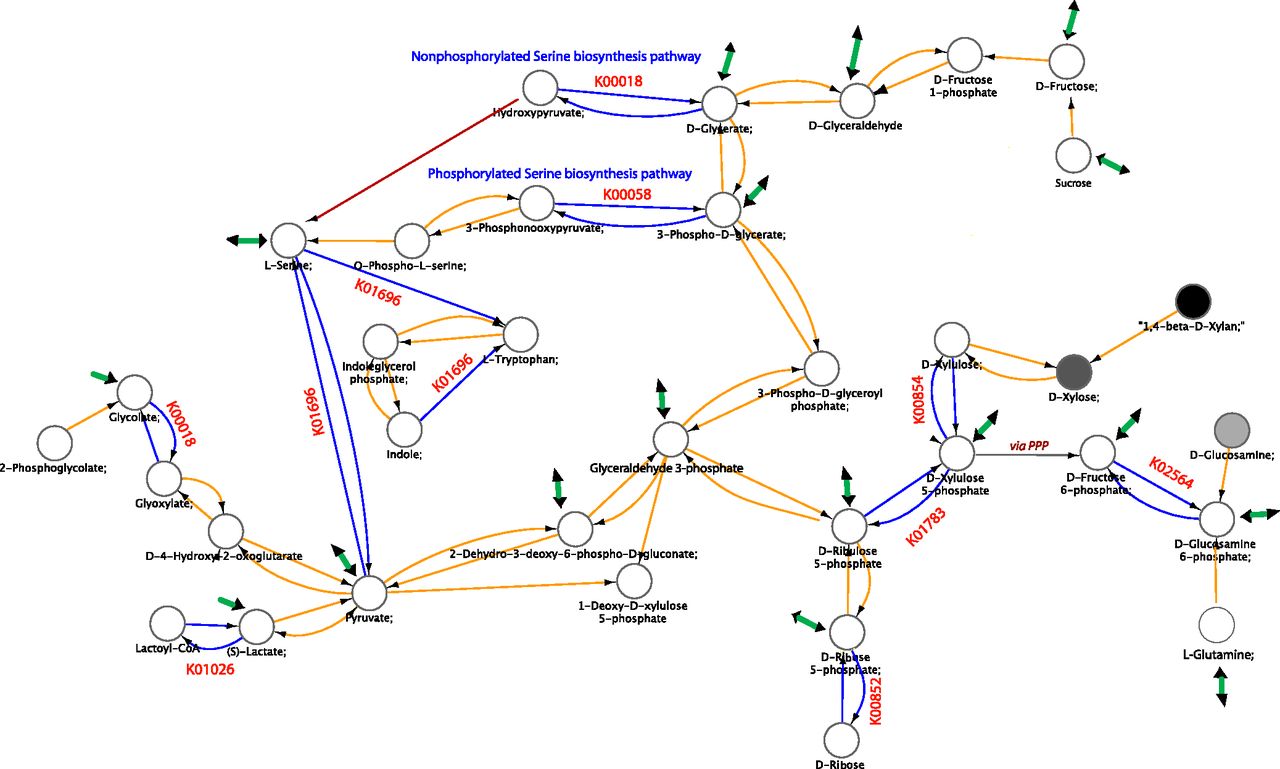
Figure 4.
Metabolic network. Generated based on the combined metabolic network of M1 and M3 genomes (see Methods). The nodes (circles) are compounds and the edges are reactions. Edges colored blue have more copies or are more likely present in M3 genomes compared with M1. Red edges are reactions known to occur, but no described enzymes that perform them are in any of these genomes. The node color indicates the fraction of M3 genomes in which that compound is found with white being 100% and black being 0%. The thick green edges indicate that branches of the network emanating from that node were eliminated from the figure.


