
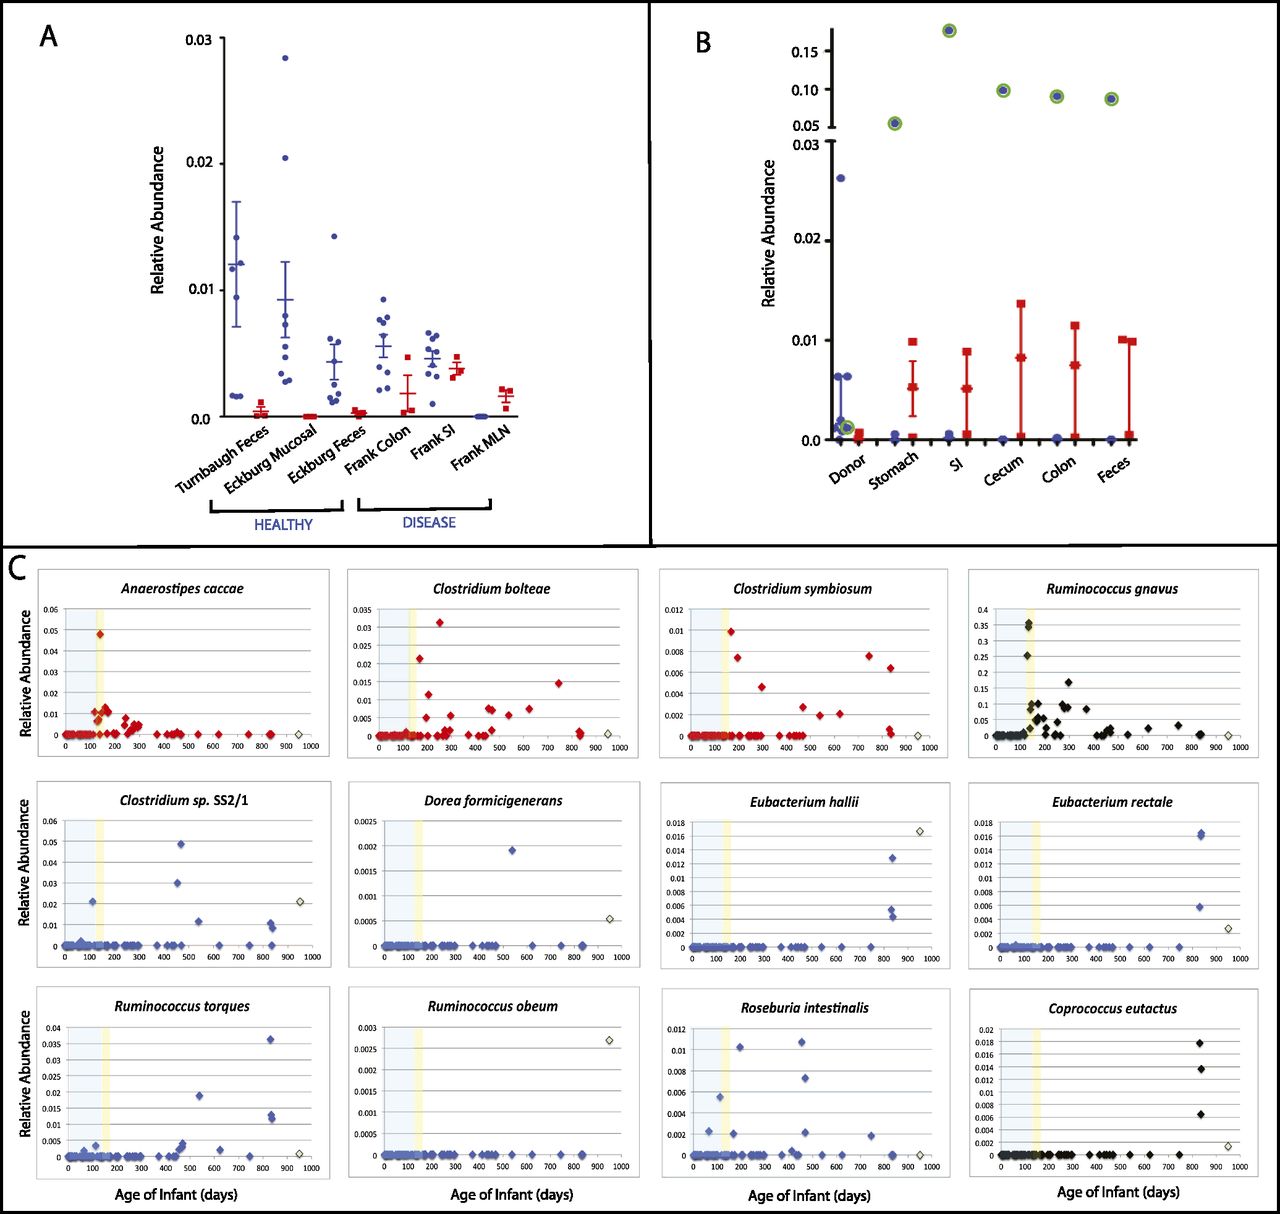
Relative abundance of species in M1 and M3 in various gut samples. Sample categories are detailed in Supplemental Table S2. (A) Average relative abundance across samples from individuals with and without gastrointestinal disease. (Blue circles) M1 species; (red squares) M3 species. The SEM for each treatment is plotted. For healthy, estimated using data from (1) stool samples from obese and lean twins and their mothers (Turnbaugh et al. 2009a) (Turnbaugh Feces), (2) samples from three healthy adults from six mucosal sites along the length of the colon (Eckburg et al. 2005) (Eckburg Mucosal), (3) fecal samples from the same three individuals as in Eckburg Mucosal (Eckburg Feces). For diseased, averaged relative abundance across (1) colon (Frank Colon), (2) small intestine (Frank SI), and (3) MLNs (Frank MLN) from individuals with gastrointestinal disease including Crohn's disease, ulcerative colitis, and colon cancer from Frank et al. (2007) (B) Results from humanized gnotobiotic mice (Turnbaugh et al. 2009b). Fecal samples from the healthy human donor (donor, [1]) and from the recipient gnotobiotic mice ([2] stomach, [3] small intestine [SI], [4] cecum, [5] colon, and [6] feces). The points representing R. torques, which was an outlier in this analysis, are marked with a green circle. Error bars represent the median and interquartile range. (C) Age trends in M1 and M3 species in a single infant using data from Koenig et al. ( 2011). The x-axis in each plot is the age in days and the y-axis is the relative abundance in a single sample. The species in M1 have series colored in blue, M3 red, and those with no detected co-occurring microbes are in black. The relative abundance of each OTU in the mother is plotted at day 950 in light green. The period before the introduction of solid food is shaded in blue and between then and the switch from breast milk to formula is shaded in yellow. Ruminococcus sp. SR 1/5 was not evaluated because sequence information for the V2 region of its 16S rRNA is incomplete. Coprococcus comes is not shown because it was absent across the infant timeseries and in the mother.


