
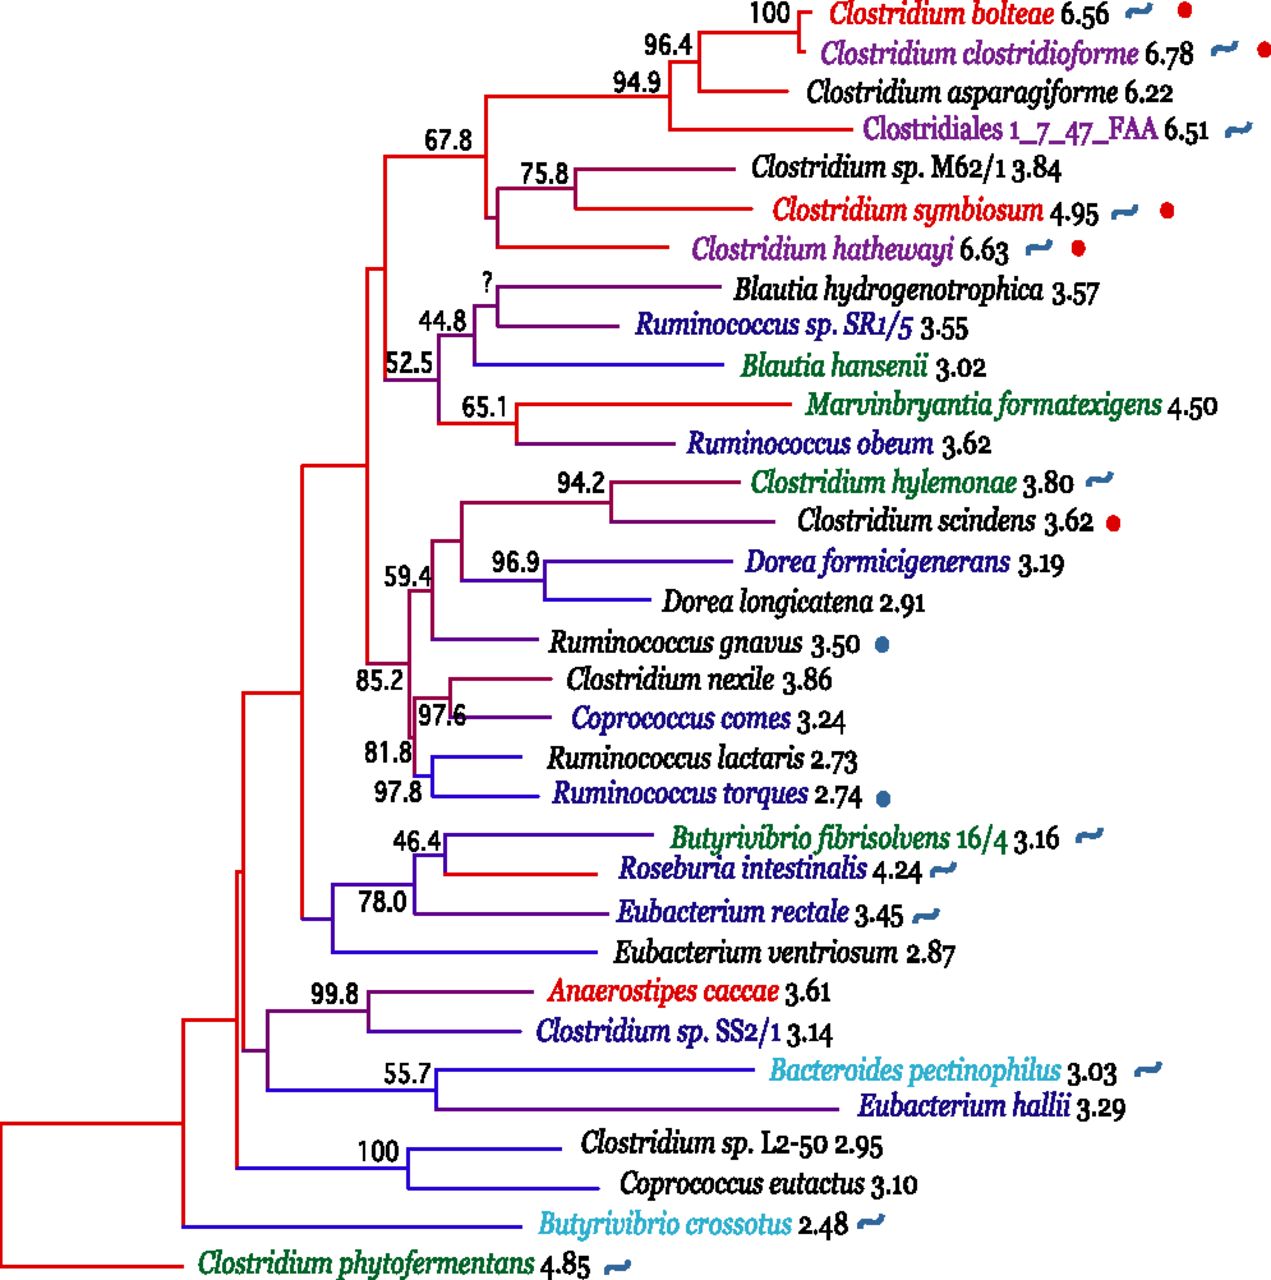
Phylogenetic relationships between species in Clostridium cluster XIVa. Bootstrap support (based on 1000 replicates) is indicated on the branches of the 16S rRNA NJ tree when >40% (except for Ruminococcus sp. SR1/5, as this was added by parsimony insertion after the initial tree creation, since only a short region of 16S rRNA sequence was available; see Methods). The species names are colored according to their module in the co-occurrence network: M1 (blue), M2 (turquoise), M3 (red), and M4 (green). Species that were evaluated in the network analysis but showed no significant co-occurrence are in black text. Species that were not evaluated for co-occurrence are colored purple. These were added to further support that the species in this group that can cause disease form a clade with expanded genome size. The branches are colored by genome size rank, with the red branches representing the largest genomes and the blue branches the smallest. The genome size in Mb is listed after the species name. Species that have been recovered from clinical samples (e.g., bacteremia) are marked with a red circle, and those reported to be in increased abundance with IBD are marked with a blue circle. Species that contain the genomic machinery for a flagellum are marked with a blue curved line. Note that the network diagram only shows species with significant co-occurrence with at least one other species; thus 36.7% (11/30) of evaluated species in Clostridium cluster XIVa, are not shown. Details about the evaluated species are provided in Table 1.


