
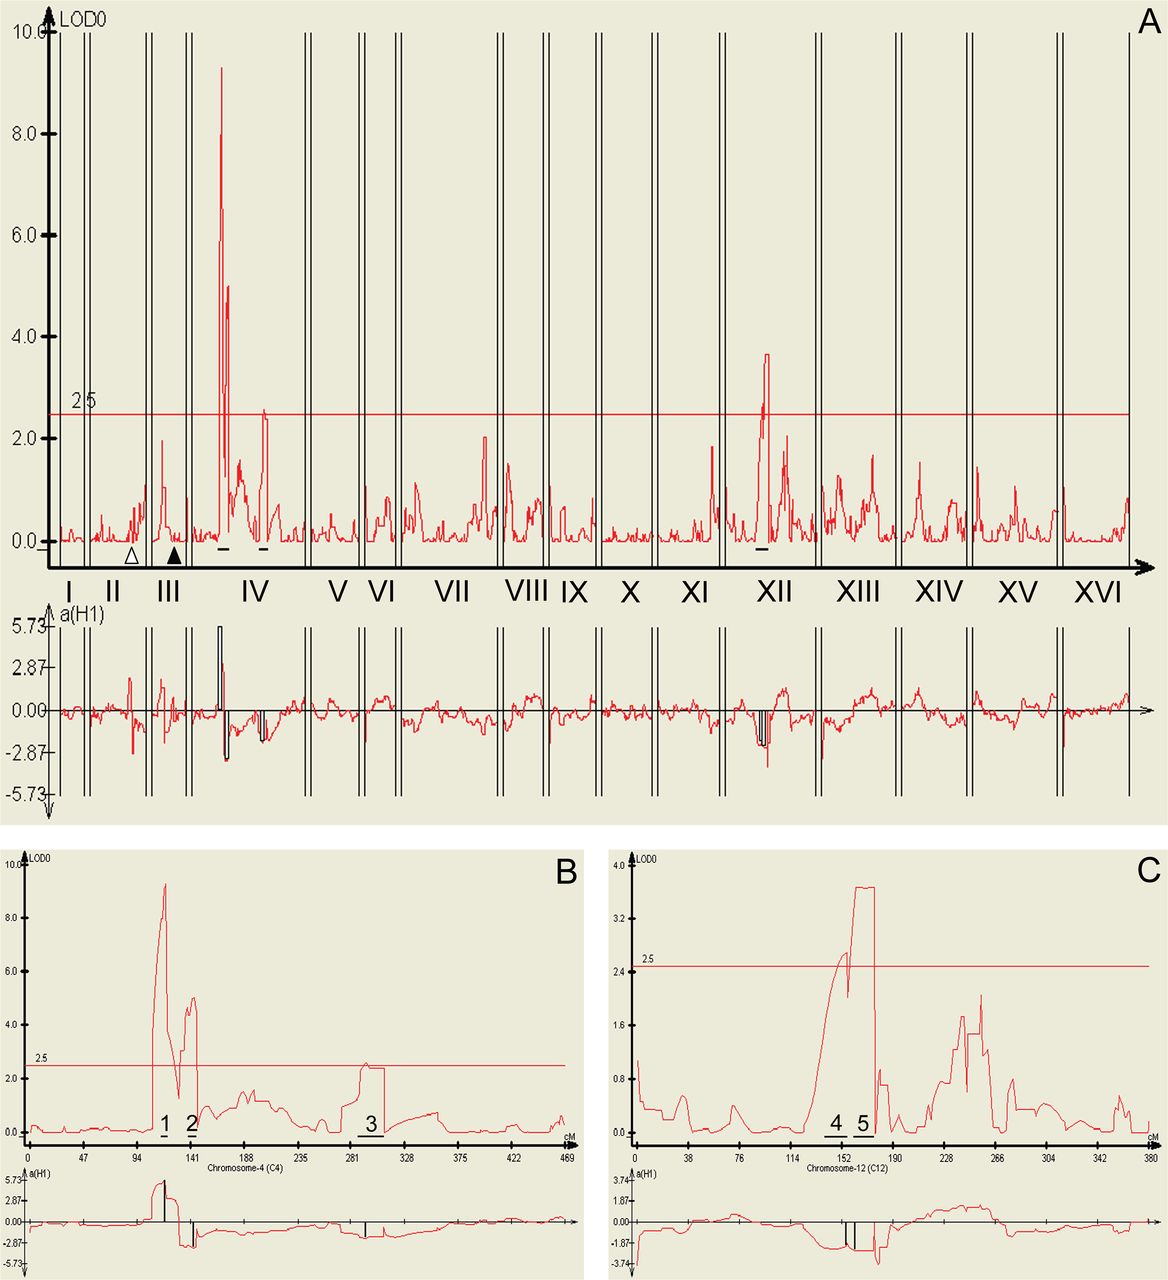
Composite interval mapping of RLS QTL. (A) The upper panel depicts all QTL in all 16 yeast chromosomes, each indicated by a roman numeral. (B) QTL 1, 2, and 3 on chromosome IV have LOD scores of 9.27, 5.02, and 2.60, respectively. (C) QTL 4 and 5 on chromosome XII have LOD scores of 2.70 and 3.68, respectively. In all panels, the top graphs show the LOD score (y-axis) versus genetic distance in centimorgans (x-axis). A LOD score above the genome-wide significance threshold of 2.5 is evidence for a QTL. The lower graphs show the “additive effect.” Positive or negative values indicate that the parental YJM789 or S96 allele, respectively, is associated with longer RLS. The open and closed arrowheads in A indicate the positions of AMN1 and MATa on chromosomes II and III, respectively. The QTL are numbered in B and C.


